Ecological Archives E096-229-A1
Christoffer Moesgaard Albertsen, Kim Whoriskey, David Yurkowski, Anders Nielsen, and Joanna Mills Flemming. 2015. Fast fitting of non-Gaussian state-space models to animal movement data via Template Model Builder. Ecology 96:25982604. http://dx.doi.org/10.1890/14-2101.1
Appendix A. Detailed description of the simulation study.
The simulation study was based on the subadult ringed seal data so as to ensure a realistic setting in which to compare the five methods: crawl, bsam, TMB-t, TMB-g, and TMB-gr. That is, using the time steps and location classes from these data, tracks were simulated with the parameters log(β1)=log(β2) = -0.84, log(σ1) = -4.481, log(σ2) = -3.749 and γ1 = γ2=0. This implied that all simulated tracks experienced zero drift, and that autocorrelation was similar across coordinate axes. Afterwards measurement errors were bootstrapped from the residuals of the TMB-t fit. We did not assume a specific distribution for the measurement error to make for a fair comparison of the different implementations. In the TMB implementations, no initial distribution of the states where specified as the Laplace approximation does not require explicit initial distributions for the velocity or location processes. An unspecified initial distribution for the processes corresponds to assuming a uniform distribution on the real line for each of the initial states.
A total of 200 tracks were simulated on a High Performance Computer, but only the 161 tracks where all methods gave successful results were used for further analysis. Note that this will give a fair comparison of the methods, although it is likely to give a downwards biased RMSE. Table A1 shows the proportion of the simulations which gave a successful result for each estimation method.
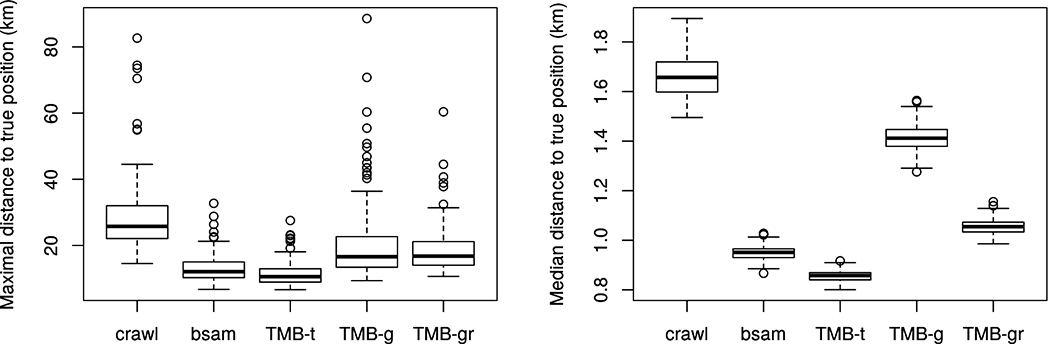
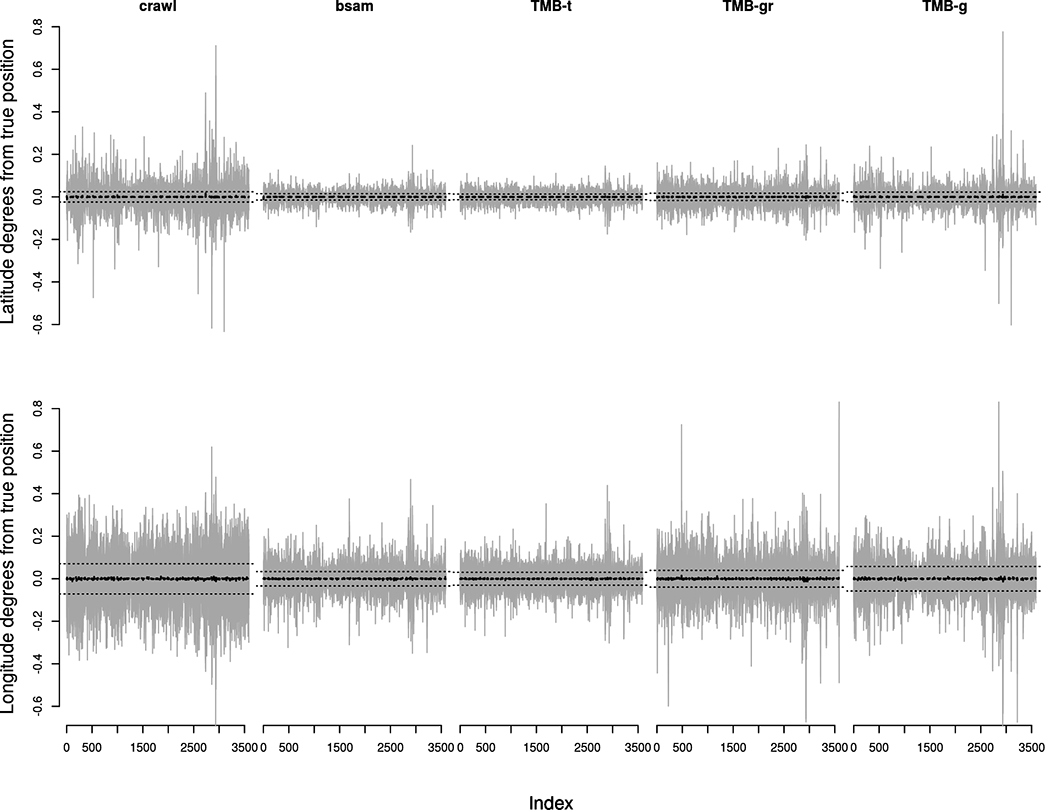
Figure A1 shows the difference between the simulated and estimated tracks for each location. This information is summarized in Fig. A2, which shows the maximal and median distances between the simulated and estimated positions for each method.
Table A1. Proportion of the simulated data sets which gave a successful result for each method.
| crawl | bsam | TMB-t | TMB-g | TMB-gr | |
|---|---|---|---|---|---|
| Converged | 0.90 | 1.00 | 0.84 | 1.00 | 0.95 |
| Not converged | 0.01 | 0.00 | 0.16 | 0.00 | 0.04 |
Fig. A1. Deviance between true simulated track and estimated track (grey lines), pointwise mean of deviance (black dashed line), and global 2.5% and 97.5% quantiles for the deviance (black dotted lines).
Fig. A2. Maximal and median distance between the true simulated location and the estimated locations for each track.