Ecological Archives E096-226-D1
S. Jennings and S. M. Cogan. 2015. Nitrogen and carbon stable isotope variation in northeast Atlantic fishes and squids. Ecology 96:2568. http://dx.doi.org/10.1890/15-0299.1
Metadata
Class I. Data set descriptors
A. Data set identity: Nitrogen and carbon stable isotope variation in northeast Atlantic fishes and squids.
B. Data set identification code: SIA_N_C_Atlantic_marine_fishes_squids_20150105_v1
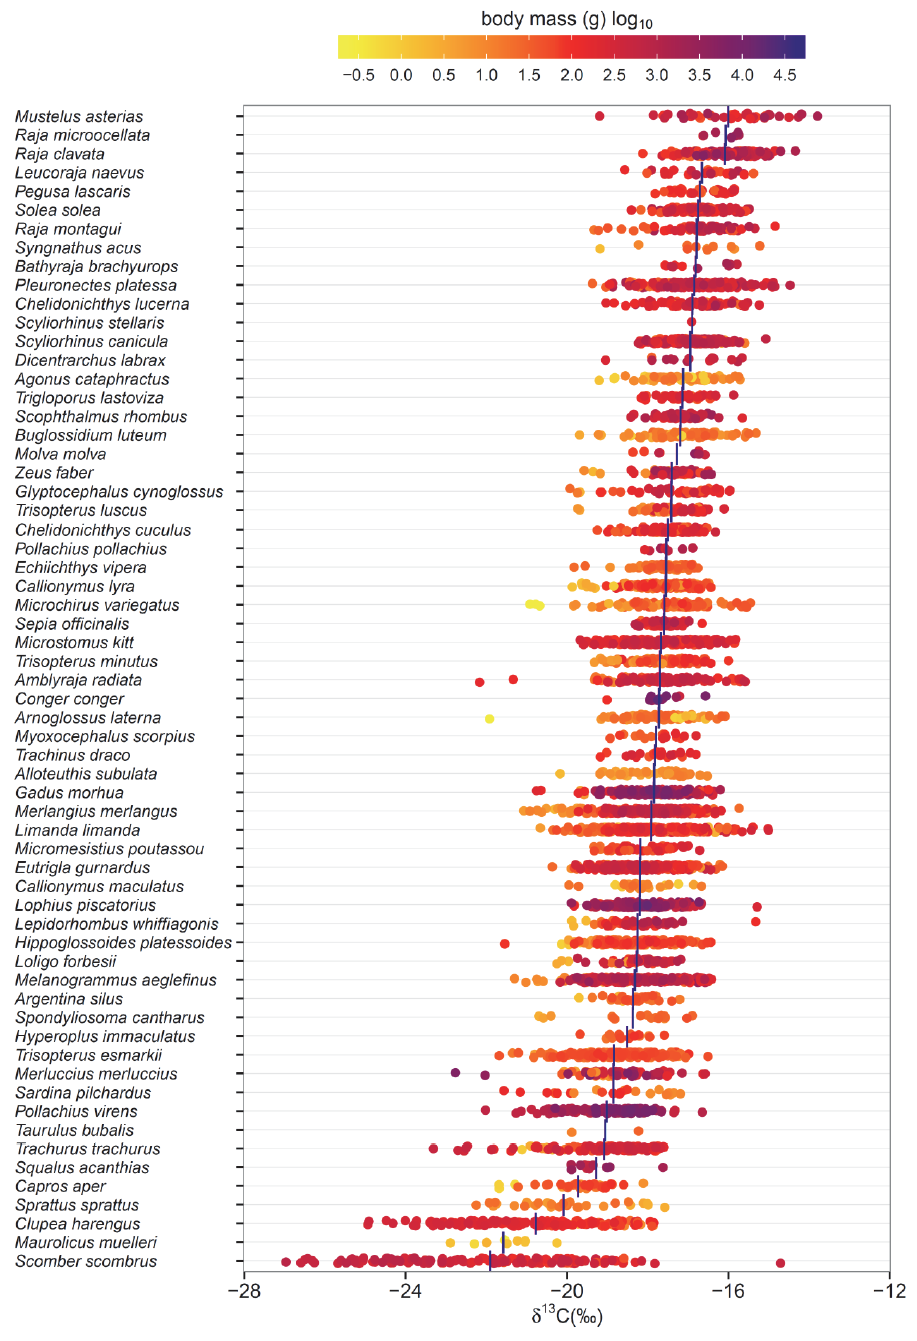
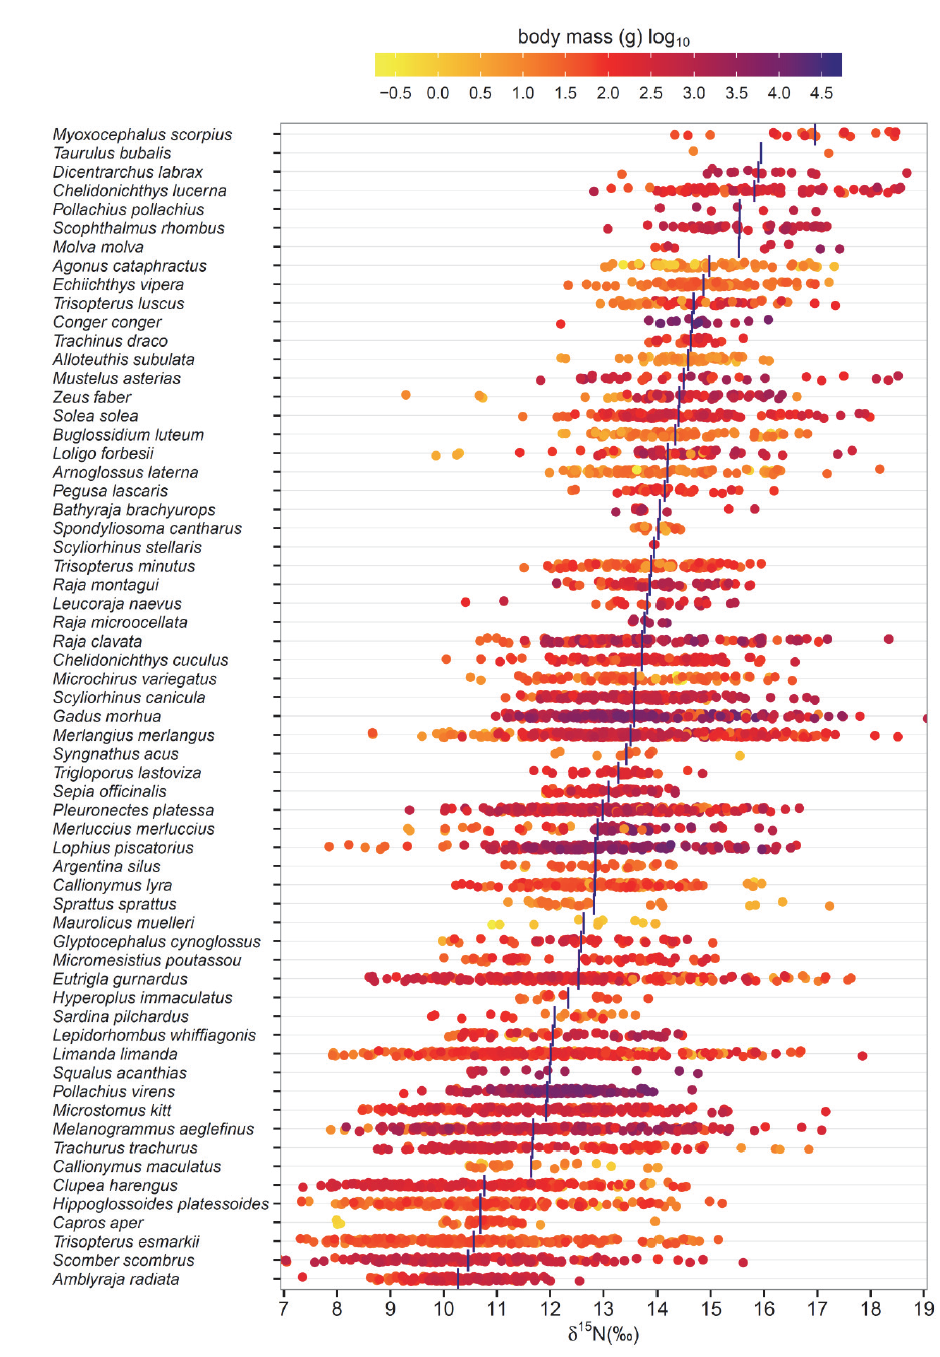
C. Data set description: 5535 records of δ15N and δ13C natural abundance for individual marine fishes and squids from the Celtic Sea, Channel, Irish Sea and North Sea in the northeast Atlantic. Data were collected from 2002 to 2010. Individuals from each species in each region were sampled to span the range of body sizes present. For species with juvenile stages living offshore the sampling included juveniles. For species with juvenile stages using estuaries and coastal habitats it did not. The range of species and body sizes included in the dataset and the associated δ15N and δ13C estimates for muscle tissue are summarized in Figs. 1 and 2.
Principal Investigator: Simon Jennings, Centre for Environment, Fisheries and Aquaculture Science, Lowestoft, Suffolk, NR33 0HT, UK. [email protected]).
Abstract: Nitrogen and carbon stable isotope data are frequently used to describe the origins and transformations of organic matter. Nitrogen stable isotopes (δ15N) in tissue are used to estimate species trophic levels, the extent of omnivory, food chain length, and community-wide relationships between body size and trophic level; the latter leading to estimates of predatorprey mass ratios for parameterization, calibration, and validation of food web models. Carbon stable isotopes (δ13C) are used to identify pathways linking producers and consumers and for studies of migration and movement. Collectively, δ15N and δ13C, often with other stable isotopes such as δ34S, may be used to define the contribution of different producers and pathways to consumer production, to assess the trophic impacts of invasive species and habitat modification, and to predict past habitat use, movements, and migrations. Stable isotope data often complement dietary data (e.g., from stomach contents) in food web studies, because stable isotope composition is indicative of assimilated diet over months to years, depending on species, size, environment, and tissue type. There are relatively few large-scale compilations of δ15N and δ13C data for marine species from offshore habitats, but such data facilitate comparative analysis and research into food web structure and function. The data provided comprise 5535 records for individuals of 62 species of fish and squid weighing 0.3 g to 17920 g and sampled from the northeast Atlantic shelf seas (Celtic Sea, North Sea, Irish Sea, Channel) from 2002 to 2010. For every sampled individual the record lists: species name, date of sampling, position of sampling, body mass, percentage nitrogen in muscle tissue, percentage carbon in muscle tissue, and δ15N and δ13C natural abundance in muscle tissue. Awareness of, and access to, these data should catalyze and facilitate new research with stable isotopes, to improve understanding of marine biology, food web ecology, and human impacts on the environment.
D. Key words: body size; cephalopod; consumer; elasmobranch; food chain; food web; marine; producer; teleost; trophic position; stable isotopes.
Class II. Research origin descriptors
A. Overall project description
Identity: Marine food webs
Originator: Simon Jennings, Centre for Environment, Fisheries and Aquaculture Science, Lowestoft, Suffolk, NR33 0HT, UK.
Period of Study: 2002–ongoing
Objectives: To improve knowledge of marine food webs; to support development of models of human and environmental impacts.
Sources of funding:U.K. Department of Environment, Food and Rural Affairs. Grants: MF0731 “Development and testing of ecological indicators and models to monitor and predict the ecosystem effects of fishing” (2002–2007), MF1001 “Ecosystem approach to fisheries” (2007–2012) and MF1225 “Developing the evidence base to support the integration of fisheries and environmental management” (2012, ongoing).
Class III. Data set status and accessibility
A. Status
Latest update: 1 May 2015.
Latest Archive date: 1 May 2015
Metadata status: The metadata are complete and up to date.
Data verification: Data quality has been checked as described in Class V, section B, below.
B. Accessibility
Storage location and medium: As well as being made available by Ecological Archives, copies of the latest version of the data file are stored on the network at the Centre for Environment, Fisheries and Aquaculture Science.
Contact person: Simon Jennings, Centre for Environment, Fisheries and Aquaculture Science, Lowestoft,Suffolk, NR33 0HT, UK.
Phone: +44 1502 562244, Fax: +44 1502 513865
E-mail: [email protected]
Copyright restrictions: None.
Proprietary restrictions: None.
Costs: None.
Class IV. Data structural descriptors
A. Data Set File
Identity: SIA_N_C_Atlantic_marine_fishes_squids_20150105_v1.csv
Size: 5535 records, excluding header row.
Format and storage mode: Text file “.csv” format.
Header information: Headers describe contents of columns. Detailed descriptions of column headers and contents are provided in Section B.
Alphanumeric attributes: Mixed.
Special characters/fields: None. All character and numeric fields are complete and follow descriptions in Table 1.
Authentication procedures: The data set comprises 5536 rows by 12 columns, including one row of headers (variable names). The sums of the 5535 records in each of the 10 columns containing numeric data are: “record”=15320880; “year”= 11112889; “DOY”= 1372534; “latitude”= 300563.1; “longitude”= -8533.36; “mass”= 2473971; “Nperc”=77571.26; “Cperc”= 254435.4; “d15N” =70738.57; “d13C”= -99601.6.
B. Variable information
Table 1 provides the name and description for each variable identified in the data set. Details of species identities are elaborated in Table 2.
Table 1. Details of variables used in data file “SIA_N_C_Atlantic_marine_fishes_squids_20150105_v1.csv”
Variable name |
Variable definition |
Units |
Data type |
Range of numeric values |
record |
Record number |
N.A. |
Integer |
1:5535 |
species |
Latin binomial species name (see Table 2 for list of species and taxonomic classification) |
N.A. |
Character |
N.A. |
year |
Year of sampling |
year |
Integer |
2002 : 2010 |
DOY |
Day of year of sampling (from 1 January = DOY 1) in year of sampling |
day |
Integer |
168 : 335 |
latitude |
Latitude at sampling position (N) |
Degrees |
Numeric |
49.05 : 59.50 |
longitude |
Longitude at sampling position (E, positive values; W, negative values) |
Degrees |
Numeric |
-08.91 : 02.00 |
sea |
Sea area that includes sampling position |
N.A. |
Character |
N.A. |
mass |
Total wet mass of sampled individual |
g |
Numeric |
0.3 : 17920 |
Nperc |
Percentage nitrogen by mass in dried muscle tissue |
% |
Numeric |
2.65 : 28.86 |
Cperc |
Percentage carbon by mass in dried muscle tissue |
% |
Numeric |
11.20 : 93.86 |
d15N |
Nitrogen stable isotope content of muscle tissue as δ15N |
‰ |
Numeric |
5.77 : 19.25 |
d13C |
Nitrogen stable isotope content of muscle tissue as δ13C |
‰ |
Numeric |
-26.97 : -13.79 |
Table 2. Sampled species, taxonomic affiliations and size ranges of fishes for which δ15N and δ13C data are provided. Aphia ID is the unique species identification number used in the “World Register of Marine Species” (WoRMS).
Species |
Authority |
Common name (U.K.) |
Aphia ID |
Class |
Order |
Family |
Number |
Minimum |
Maximum |
Agonus cataphractus |
(Linnaeus, 1758) |
pogge |
127190 |
Actinopterygii |
Scorpaeniformes |
Agonidae |
66 |
0.4 |
21.7 |
Alloteuthis subulata |
(Lamarck, 1798) |
squid |
153131 |
Cephalopoda |
Myopsida |
Loliginidae |
56 |
1.8 |
14.9 |
Amblyraja radiata |
(Donovan, 1808) |
starry ray |
105865 |
Elasmobranchii |
Rajiformes |
Rajidae |
144 |
5.3 |
735.0 |
Argentina silus |
(Ascanius, 1775) |
argentine |
126715 |
Actinopterygii |
Osmeriformes |
Argentinidae |
33 |
1.4 |
60.2 |
Arnoglossus laterna |
(Walbaum, 1792) |
scaldfish |
127126 |
Actinopterygii |
Pleuronectiformes |
Bothidae |
80 |
0.3 |
60.5 |
Bathyraja brachyurops |
(Fowler, 1910) |
blonde ray |
271509 |
Elasmobranchii |
Rajiformes |
Arhynchobatidae |
11 |
98.0 |
1942.0 |
Buglossidium luteum |
(Risso, 1810) |
solenette |
127153 |
Actinopterygii |
Pleuronectiformes |
Soleidae |
86 |
0.6 |
39.8 |
Callionymus lyra |
Linnaeus, 1758 |
common dragonet |
126792 |
Actinopterygii |
Perciformes |
Callionymidae |
187 |
1.0 |
166.0 |
Callionymus maculatus |
Rafinesque, 1810 |
spotted dragonet |
126793 |
Actinopterygii |
Perciformes |
Callionymidae |
25 |
0.9 |
23.6 |
Capros aper |
(Linnaeus, 1758) |
boarfish |
127419 |
Actinopterygii |
Perciformes |
Caproidae |
37 |
0.6 |
94.0 |
Chelidonichthys cuculus |
(Linnaeus, 1758) |
red gurnard |
127259 |
Actinopterygii |
Scorpaeniformes |
Triglidae |
102 |
22.1 |
508.6 |
Chelidonichthys lucerna |
(Linnaeus, 1758) |
tub gurnard |
127262 |
Actinopterygii |
Scorpaeniformes |
Triglidae |
85 |
15.1 |
1679.0 |
Clupea harengus |
Linnaeus, 1758 |
herring |
126417 |
Actinopterygii |
Clupeiformes |
Clupeidae |
161 |
2.9 |
394.0 |
Conger conger |
(Linnaeus, 1758) |
conger eel |
126285 |
Actinopterygii |
Anguilliformes |
Congridae |
15 |
99.0 |
17920.0 |
Dicentrarchus labrax |
(Linnaeus, 1758) |
bass |
126975 |
Actinopterygii |
Perciformes |
Moronidae |
15 |
32.4 |
1275.0 |
Echiichthys vipera |
(Cuvier, 1829) |
lesser weaver |
150630 |
Actinopterygii |
Perciformes |
Trachinidae |
89 |
4.4 |
57.8 |
Eutrigla gurnardus |
(Linnaeus, 1758) |
grey gurnard |
150637 |
Actinopterygii |
Scorpaeniformes |
Triglidae |
248 |
1.7 |
724.5 |
Gadus morhua |
Linnaeus, 1758 |
cod |
126436 |
Actinopterygii |
Gadiformes |
Gadidae |
228 |
5.2 |
13960.0 |
Glyptocephalus cynoglossus |
(Linnaeus, 1758) |
witch |
127136 |
Actinopterygii |
Pleuronectiformes |
Pleuronectidae |
42 |
2.6 |
643.0 |
Hippoglossoides platessoides |
(Fabricius, 1780) |
long rough dab |
127137 |
Actinopterygii |
Pleuronectiformes |
Pleuronectidae |
188 |
0.8 |
215.4 |
Hyperoplus immaculatus |
(Corbin, 1950) |
sandeel |
126755 |
Actinopterygii |
Perciformes |
Ammodytidae |
15 |
14.3 |
90.5 |
Lepidorhombus whiffiagonis |
(Walbaum, 1792) |
megrim |
127146 |
Actinopterygii |
Pleuronectiformes |
Scophthalmidae |
57 |
1.8 |
1943.0 |
Leucoraja naevus |
(Müller & Henle, 1841) |
cuckoo ray |
105876 |
Elasmobranchii |
Rajiformes |
Rajidae |
26 |
36.7 |
1183.0 |
Limanda limanda |
(Linnaeus, 1758) |
dab |
127139 |
Actinopterygii |
Pleuronectiformes |
Pleuronectidae |
295 |
1.3 |
504.8 |
Loligo forbesii |
Steenstrup, 1857 |
northern squid |
416668 |
Cephalopoda |
Myopsida |
Loliginidae |
59 |
2.1 |
1970.0 |
Lophius piscatorius |
Linnaeus, 1758 |
anglerfish |
126555 |
Actinopterygii |
Lophiiformes |
Lophiidae |
159 |
6.3 |
15750.0 |
Maurolicus muelleri |
(Gmelin, 1789) |
pearlside |
127312 |
Actinopterygii |
Stomiiformes |
Sternoptychidae |
10 |
0.3 |
2.4 |
Melanogrammus aeglefinus |
(Linnaeus, 1758) |
haddock |
126437 |
Actinopterygii |
Gadiformes |
Gadidae |
227 |
4.4 |
4040.0 |
Merlangius merlangus |
(Linnaeus, 1758) |
whiting |
126438 |
Actinopterygii |
Gadiformes |
Gadidae |
319 |
2.2 |
1980.0 |
Merluccius merluccius |
(Linnaeus, 1758) |
hake |
126484 |
Actinopterygii |
Gadiformes |
Merlucciidae |
58 |
4.6 |
8090.0 |
Microchirus variegatus |
(Donovan, 1808) |
thickback sole |
274304 |
Actinopterygii |
Pleuronectiformes |
Soleidae |
96 |
0.3 |
93.4 |
Micromesistius poutassou |
(Risso, 1827) |
blue whiting |
126439 |
Actinopterygii |
Gadiformes |
Gadidae |
48 |
19.9 |
306.6 |
Microstomus kitt |
(Walbaum, 1792) |
lemon sole |
127140 |
Actinopterygii |
Pleuronectiformes |
Pleuronectidae |
217 |
12.6 |
745.0 |
Molva molva |
(Linnaeus, 1758) |
ling |
126461 |
Actinopterygii |
Gadiformes |
Lotidae |
9 |
69.1 |
3734.0 |
Mustelus asterias |
Cloquet, 1819 |
starry smoothhound |
105821 |
Elasmobranchii |
Carcharhiniformes |
Triakidae |
37 |
50.4 |
2304.0 |
Myoxocephalus scorpius |
(Linnaeus, 1758) |
bullrout |
127203 |
Actinopterygii |
Scorpaeniformes |
Cottidae |
19 |
26.8 |
222.8 |
Pegusa lascaris |
(Risso, 1810) |
sand sole |
127156 |
Actinopterygii |
Pleuronectiformes |
Soleidae |
31 |
22.3 |
311.8 |
Pleuronectes platessa |
Linnaeus, 1758 |
plaice |
127143 |
Actinopterygii |
Pleuronectiformes |
Pleuronectidae |
279 |
4.7 |
1819.0 |
Pollachius pollachius |
(Linnaeus, 1758) |
pollack |
126440 |
Actinopterygii |
Gadiformes |
Gadidae |
7 |
207.4 |
1870.0 |
Pollachius virens |
(Linnaeus, 1758) |
saithe |
126441 |
Actinopterygii |
Gadiformes |
Gadidae |
147 |
28.2 |
11720.0 |
Raja clavata |
Linnaeus, 1758 |
thornback ray |
105883 |
Elasmobranchii |
Rajiformes |
Rajidae |
118 |
20.8 |
5460.0 |
Raja microocellata |
Montagu, 1818 |
painted ray |
105885 |
Elasmobranchii |
Rajiformes |
Rajidae |
8 |
261.0 |
4210.0 |
Raja montagui |
Fowler, 1910 |
spotted ray |
105887 |
Elasmobranchii |
Rajiformes |
Rajidae |
64 |
18.4 |
1671.0 |
Sardina pilchardus |
(Walbaum, 1792) |
pilchard |
126421 |
Actinopterygii |
Clupeiformes |
Clupeidae |
23 |
7.7 |
141.8 |
Scomber scombrus |
Linnaeus, 1758 |
mackerel |
127023 |
Actinopterygii |
Perciformes |
Scombridae |
155 |
17.6 |
864.0 |
Scophthalmus rhombus |
(Linnaeus, 1758) |
brill |
127150 |
Actinopterygii |
Pleuronectiformes |
Scophthalmidae |
45 |
170.7 |
2420.0 |
Scyliorhinus canicula |
(Linnaeus, 1758) |
lesser spotted dogfish |
105814 |
Elasmobranchii |
Carcharhiniformes |
Scyliorhinidae |
183 |
3.8 |
1099.5 |
Scyliorhinus stellaris |
(Linnaeus, 1758) |
nurse hound |
105815 |
Elasmobranchii |
Carcharhiniformes |
Scyliorhinidae |
1 |
263.2 |
263.2 |
Sepia officinalis |
Linnaeus, 1758 |
cuttlefish |
141444 |
Cephalopoda |
Sepiida |
Sepiidae |
64 |
3.2 |
1295.0 |
Solea solea |
(Linnaeus, 1758) |
sole |
127160 |
Actinopterygii |
Pleuronectiformes |
Soleidae |
124 |
15.1 |
1267.0 |
Spondyliosoma cantharus |
(Linnaeus, 1758) |
black sea bream |
127066 |
Actinopterygii |
Perciformes |
Sparidae |
17 |
2.7 |
52.5 |
Sprattus sprattus |
(Linnaeus, 1758) |
sprat |
126425 |
Actinopterygii |
Clupeiformes |
Clupeidae |
32 |
2.4 |
25.8 |
Squalus acanthias |
Linnaeus, 1758 |
spurdog |
105923 |
Elasmobranchii |
Squaliformes |
Squalidae |
12 |
341.0 |
4730.0 |
Syngnathus acus |
Linnaeus, 1758 |
greater pipefish |
127387 |
Actinopterygii |
Syngnathiformes |
Syngnathidae |
11 |
1.6 |
42.6 |
Taurulus bubalis |
(Euphrasen, 1786) |
sea scorpion |
127204 |
Actinopterygii |
Scorpaeniformes |
Cottidae |
2 |
11.8 |
29.4 |
Trachinus draco |
Linnaeus, 1758 |
greater weever |
127082 |
Actinopterygii |
Perciformes |
Trachinidae |
23 |
39.1 |
412.0 |
Trachurus trachurus |
(Linnaeus, 1758) |
scad |
126822 |
Actinopterygii |
Perciformes |
Carangidae |
139 |
1.0 |
610.0 |
Trigloporus lastoviza |
(Bonnaterre, 1788) |
streaked gurnard |
154462 |
Actinopterygii |
Scorpaeniformes |
Triglidae |
36 |
30.4 |
452.0 |
Trisopterus esmarkii |
(Nilsson, 1855) |
Norway pout |
126444 |
Actinopterygii |
Gadiformes |
Gadidae |
232 |
2.2 |
135.3 |
Trisopterus luscus |
(Linnaeus, 1758) |
pout |
126445 |
Actinopterygii |
Gadiformes |
Gadidae |
59 |
4.3 |
693.0 |
Trisopterus minutus |
(Linnaeus, 1758) |
poor cod |
126446 |
Actinopterygii |
Gadiformes |
Gadidae |
114 |
3.3 |
161.8 |
Zeus faber |
Linnaeus, 1758 |
john dory |
127427 |
Actinopterygii |
Zeiformes |
Zeidae |
60 |
2.0 |
2169.0 |
Fig. 1. Summary of the ranges of species and body sizes for which δ15N data are available. Data presented are for all sampling years and areas combined. Vertical blue bars indicate mean δ15N by species. Points are ‘jittered’ (i.e., offset) to increase visibility. Taxonomy follows Table 2.
Fig. 2. Summary of the ranges of species and body sizes for which δ13C data are available. Data presented are for all sampling years and areas combined. Vertical blue bars indicate mean δ13N by species. Points are ‘jittered’ to increase visibility. Taxonomy follows Table 2.
Class V. Supplemental descriptors
A. Data acquisition
In the northern North Sea fishes were caught at 21 stations in an area from 57.5° N - 61.5° N and 1° W - 4° E The stations were fished every year from 2002 to 2006 with a Grande Ouverture Verticale (GOV) bottom fished otter trawl net fitted with a 20-mm cod-end liner and towed for approximately 30 minutes at approximately 4 knots. The area was sampled in August and/ or September during the North Sea English Bottom Trawl Survey (2002: 25 Aug to 4 Sept; 2003: 22 Aug to 2 Sept; 2004: 22 Aug to 30 Aug; 2005: 16 Sept to 22 Sept; 2006: 25 Aug to 8 Sept). In the data set, all fishing positions are assigned to the latitude and longitude at the center of the sampled area and to the midpoint date of the sampling period in each year.
For each of 15 fish species shown to have the highest rank biomass in North Sea English Bottom Trawl Survey data from the sampling area in 2000 and 2001, the sampling aim for each of the years 2002 to 2006 was to collect up to 4 individuals from each of 10–13 length classes spanning the range of total body lengths caught in 2000 and 2001. Length class intervals ranged from 1 cm for the smallest species to 7 cm for the largest. The total weight of each individual assigned to a length class was recorded to the nearest 0.1 g wet mass (after “blotting” to remove surface water), or to 1g for larger fishes (typically >1 kg). One to five cm3 of white muscle tissue was dissected from the dorsal musculature of each individual and immediately frozen to < –20°C and stored frozen until the next step of processing (freeze drying), a procedure that has no effect on the nitrogen stable isotope composition of fish tissue (Sweeting et al. 2004).
In areas other than the northern North Sea (south and central North Sea, Channel, Irish Sea, and Celtic Sea) fishes and squids were caught with GOV otter trawl or 4-m beam trawl in 2010. The GOV and 4 m beam trawls were towed for approximately 30 minutes at a speed of approximately 4 knots. For these data, all positions were assigned to the latitude and longitude where the net was shot.
The sampling aim for 2010 was to catch up to six individuals from each of 7 to 12 length classes spanning body length ranges of fishes and squid recorded in previous surveys in each sea area (south and central North Sea, Channel (stratified by 4 sub-areas), Irish Sea (3 sub-areas) and Celtic Sea (2 subareas)). Classes ranged from 2 cm for the smallest species to 10 cm for the largest. The total weight of each individual assigned to a length class was recorded to the nearest 0.1 g wet blotted weight for smaller fishes, or to 1g for most fishes >1 kg. Up to two cm3 of white muscle tissue was dissected from the dorsal musculature of each individual fish, or from the mantle for each individual squid, and immediately frozen and then stored at –20° C until it could be freeze-dried.
In the laboratory, frozen fish and squid tissue was freeze dried to constant mass and ground with pestle and mortar to fine homogeneous powder. All equipment was cleaned after processing each individual sample and the powdered material was transferred to a new glass vial. The nitrogen and carbon stable isotopic composition of the powdered samples was determined using a Europa Scientific 20-20 IRMS with a Europa Scientific Roboprep-CN preparation module by Iso-Analytical Ltd (Crewe, UK). Two reference samples were analysed after every four to six samples of fish tissue. The reference materials used during analysis of all samples were Iso-Analytical Standards IA-R014 (powdered bovine liver), IA-R005 (beet sugar) and IA-R045 and IA-R046 (ammonium sulphate) (see B. Quality assurance/ quality control procedures). Twenty percent of fish and squid samples were processed in duplicate for quality control. The 15N and 13C composition of tissue samples was expressed in conventional delta notation (δ15N and δ13C), relative to the abundance of 15N in atmospheric N2 and 13C in Pee Dee Belemnite. Experimental precision, measured as the standard deviation in δ15N or δ13C for replicates of reference material, was < 0.1‰ for both isotopes in all batches of samples. Within batches of samples, the standard deviation of the distribution of differences in δ15N or δ13C between the two samples in each duplicated pair tended to be slightly higher than the standard deviation of δ15N or δ13C for replicates of reference material (< 0.25‰ for either isotope in any batch), but the 95th percentile of the overall distribution of absolute differences in δ15N or δ13C between the two samples in each duplicated pair (i.e., for all 1107 samples processed in duplicate) was 0.17 ‰ for δ15N and 0.21 for δ13C.
13C analysis was conducted without lipid extraction. Previous work has shown that δ13C data for fish can be corrected for differences lipid content using C:N ratio data (Fry et al. 2003) and that the results are consistent with those obtained for fish tissue following chemical lipid extraction (Sweeting et al. 2006). The δ13C data included in the published data set are not corrected for differences in lipid content, but the percentage C and N data that are included can be used to make the correction if required. Logan et al. (2008) provide further information on methods of lipid correction and their performance.
B. Quality assurance/quality control procedures:
All documentation, tracking of samples and entry of data was independently reviewed by at least one other scientist and all projects supporting the collection and processing of samples followed the Joint Code of Practice for Research (JCoPR) of the U.K. Department of Environment, Food and Rural Affairs and the U.K. Research Councils. Independent review involved line by line checking of the reference code used to track the sample from capture through processing and isotope analysis against (1) the record of species identity, size and capture location from the cruise, (2) the record of labelling and processing and (3) the record that included the results of the stable isotope data. The standards used by Iso-Analytical are calibrated against and traceable to inter-laboratory comparison standards distributed by the International Atomic Energy Agency (IAEA). IA-R042 (which comprises a mixture of IA-R005 and IA-R045) is calibrated against and traceable to IAEA-CH-6 and IAEA-N-1. IA-R005 is calibrated against and traceable to IAEA-CH-6. IA-R045 and IA-R046 are calibrated against and traceable to IAEA-N-1.
C. Related material: None.
D. Computer programs and data processing algorithms: None.
E. Archiving: The data file and the results of individual analyses with associated Quality Assurance and Quality Control data are stored on the network at the Centre for Environment, Fisheries and Aquaculture Science, Lowestoft, United Kingdom.
F. Literature Cited:
Fry, B., D. M. Baltz, M. C. Benfield, J. W. Fleeger, A. Gace, H. L. Haas, and Z. J. Quiñones-Rivera. 2003. Stable isotope indicators of movement and residency for brown shrimp (Farfantepenaeus aztecus) in coastal Louisiana marshscapes. Estuaries 26:82–97.
Logan, J. M., T. D. Jardine, T. J. Miller, S. E. Bunn, R. A. Cunjak, and M. E. Lutcavage. 2008. Lipid corrections in carbon and nitrogen stable isotope analyses: comparison of chemical extraction and modelling methods. Journal of Animal Ecology 77:838–846.
Sweeting, C. J., N. V. C. Polunin, and S. Jennings. 2004. Tissue and fixative dependent shifts of δ13C and δ15N in preserved ecological material. Rapid Communications in Mass Spectrometry 18:2587–2592.
Sweeting C.J., N. V. C. Polunin, and S. Jennings. 2006. Effects of chemical lipid extraction and arithmetic lipid correction on stable isotope ratios of fish tissues. Rapid Communications in Mass Spectrometry 20: 595–601.
G. History of data set usage:
Data included in this data set have been used in the analyses reported by:
Jennings, S., C. Barnes, and N. V. C. Polunin. 2008. Application of nitrogen stable isotope analysis in size-based marine food web and macroecological research. Rapid Communications in Mass Spectrometry 22:1673–1680.
Jennings, S., J. A. A. D'Oliveira, and K. J. Warr. 2007. Measurement of body size and abundance in tests of macroecological and food web theory. Journal of Animal Ecology 76:72–82.
Jennings, S., T. D. Maxwell, M. Schratzberger, and S. P. Milligan. 2008. Body-size dependent temporal variations in nitrogen stable isotope ratios in food webs. Marine Ecology Progress Series 370:199–206.
Jennings, S., R. Van Hal, J. G. Hiddink, and T. A. D. Maxwell. 2008. Fishing effects on energy use by North Sea fishes. Journal of Sea Research 60:74–88.
H. Data set update history:
Data first compiled in present form 12 November 2014, updated and checked 1 May 2015 for release to Ecological Archives.
Review history: None
Questions and comments from secondary users: None
Acknowledgments
We thank the U.K. Department of Environment, Food and Rural Affairs for their longstanding support of this research; the many scientists who assisted with at sea sampling, especially Richard Ayers, Mary Brown, Jim Ellis, Freya Goodsir, Sophie McCully and Brian Harley; Peter Davison, Roger Hillier and Jon Santillo for processing samples and Iso-Analytical for conducting the stable isotope analyses. We thank two anonymous referees for their thorough reviews of this data paper.