Ecological Archives E096-223-A4
Nathan R. Geraldi. 2015. Prey size structure diminishes cascading effects by increasing interference competition and predation among prey. Ecology 96:25332543. http://dx.doi.org/10.1890/14-1026.1
Appendix D. Detailed results from field surveys.
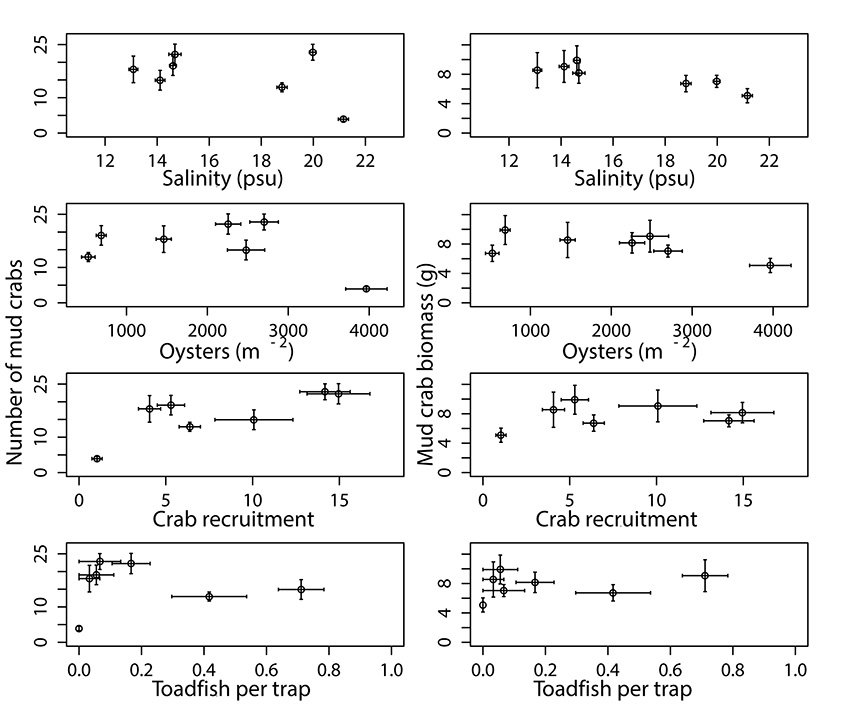
Fig. D1. Relationship between abundance (first column) or biomass (second column) of crabs per bin, and salinity, oyster density, crab recruitment (number per collector), and toadfish abundance. Bars indicate standard error.
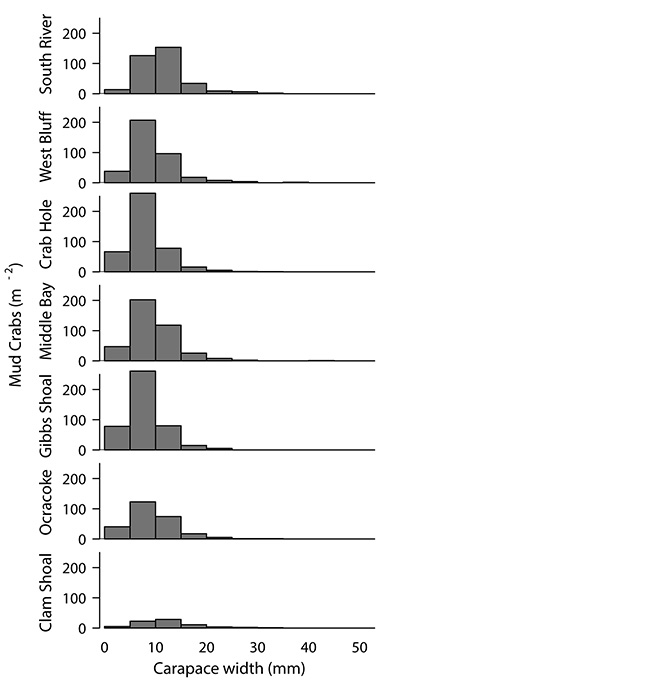
Fig. D2. The size distribution of mud crabs per m² at 7 different oyster reefs in Pamlico Sound. Names correspond to each site shown in Appendix B. Sites are ordered lowest (top) to highest salinity (bottom).
Table D1. The variation in mud crab assemblage explained by each factor determined by DistLM. Raw data were used and marginal and sequential tests were run. Bolded variables were included in the best model following stepwise selection by Adjusted R².
MARGINAL TESTS |
|||||||
Variable |
SS(trace) |
Pseudo-F |
P |
Proportion |
|||
Salinity |
1346.7 |
2.37 |
0.11 |
0.32 |
|||
Oyster denisty |
1374.3 |
2.44 |
0.17 |
0.33 |
|||
Recruitment |
1872.5 |
4.04 |
0.04 |
0.45 |
|||
Toadfish |
238.9 |
0.30 |
0.71 |
0.06 |
|||
SEQUENTIAL TESTS |
|||||||
Variable |
Adj R² |
SS(trace) |
Pseudo-F |
P |
Proportion |
Cumulative |
df |
Recruitment |
0.34 |
1872.5 |
4.04 |
0.04 |
0.45 |
0.45 |
5 |
Oyster denisty |
0.70 |
1486.5 |
7.16 |
0.05 |
0.35 |
0.80 |
4 |
Salinity |
0.73 |
256.3 |
1.34 |
0.33 |
0.06 |
0.86 |
3 |
Toadfish |
0.80 |
290.9 |
2.05 |
0.22 |
0.07 |
0.93 |
2 |
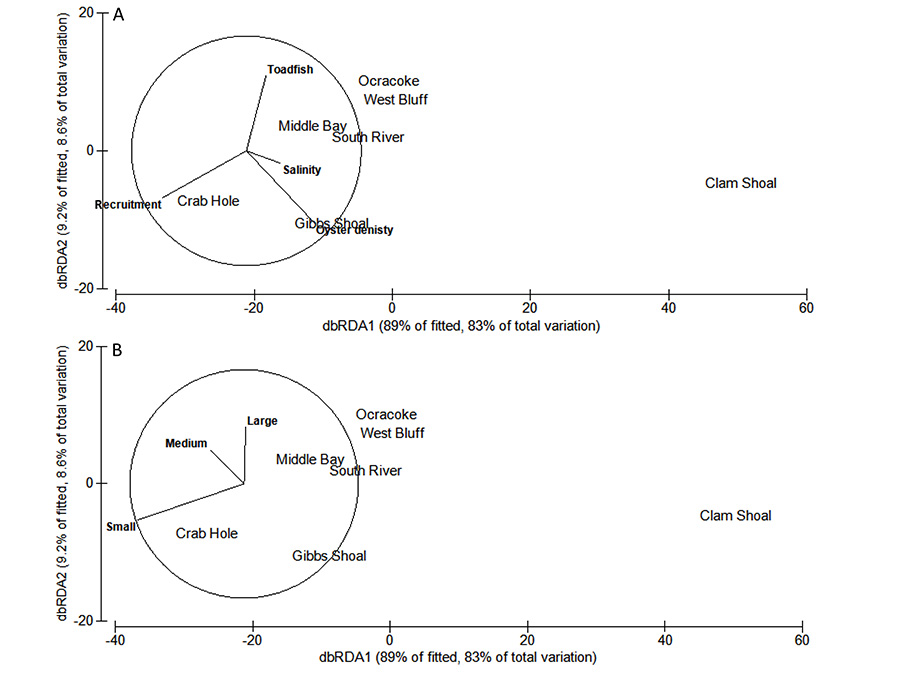
Fig. D3. The first and second axis of dbRDA of the mud crab assemblage overlaid with vectors of factors (A) and mud crab size (B).
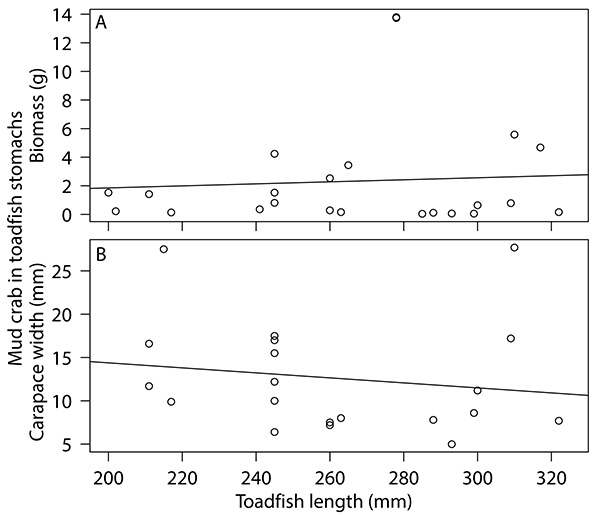
Fig. D4. Relationship between toadfish size and the biomass (A) and size (B) of mud crabs identified within toadfish stomachs.