Ecological Archives E096-223-A1
Nathan R. Geraldi. 2015. Prey size structure diminishes cascading effects by increasing interference competition and predation among prey. Ecology 96:25332543. http://dx.doi.org/10.1890/14-1026.1
Appendix A. Details on preliminary experiments, size and biomass of taxa used in the experiments, and information on the interaction calculations.
A.1 Approach
Experiment with mud crab species and their interactions
Mud crabs that inhabit oyster reefs along the U.S.A. mid-Atlantic coast consist of two species of xanthid crabs (Panopeus herbstii and Eurypanopeous depressus; Meyer 1994). These two species have similar morphology (differentiated only by P. herbstii having a small knob on the crusher claw); and similar sized xanthid crabs have similar diets (McDonald 1982), and similar agonistic interactions between and within species (Brown et al. 2005). Despite these similarities between the two species of mud crabs, I ran a preliminary experiment to test whether cannibalism and intraguild predation among mud crabs was similar. This independent experiment was run in plastic 22.7 L buckets (with 3 L of shell) with two small individuals (9–15 mm CW per trial; two-E. depressus, two-P. herbstii, or one of each species; n = 8). It was run for 3 days and then crab mortality was assessed. Crab mortality was identical in all three treatments (0.125 mud crabs consumed per trail) indicating no differences between cannibalism and interspecific predation among these two species of mud crabs.
Oyster mortality not resulting from predation
To estimate mortality of oysters from causes other than predation, 40 oysters (five per shell) were added to a Vexar bag and placed in mesocosms not being used for trials (n = 6) as oyster controls during experiment 1. Oyster mortality within the experimental tanks was attributed to predation because of the high oyster survival (99%; 237 of 240 survived) in these controls.
Mud crab mortality not resulting from predation
To ensure crabs not recovered at the end of trials was a result of mortality and not experimenter error, a control experiment was run. Twelve small crabs were added to a tank with shell at 5 pm and recovered at 9 am the next day following the procedures previously described. Six replicates were run simultaneously in October 2010. Because 99% of crabs were recovered (71 of 72 recovered), it was presumed that all crabs not recovered in the study were eaten.
Consumptive and behavioral effect calculations for experiment 1
I separated different indirect effects by calculating oyster mortality (e.g., the number of the oysters eaten per day by crabs) in the absence (M) and presence (m) of a toadfish (M=initial # of oysters-final # of oysters), the daily per-crab consumption of the oysters in absence (C) and presence (c) of a toadfish (C=M/[initial # of crabs+final # of crabs/2]), and the number of prey eaten by a predator (p; p=initial # of crabs-final # of crabs; Appendix D). The expected resource release (ER) was the amount of oysters surviving because of crabs mortality (c·p). The actual resource release (AR) was the difference between oysters consumed by crabs in the absence and presence of a toadfish (M-m). The behavioral resource release (BR), or the amount of oysters that were not eaten because crabs reduce foraging in the presence of a toadfish, was the difference between the AR and ER (AR-ER; Grabowski 2004). Thus, if the change in the numbers of resources and crabs are known, indirect effects can be estimated (Table A2).
Additional calculations were made to quantify the number of oysters not eaten because of interference competition among crabs by comparing the number of resources eaten in each of the individual size class treatments to the number of resources eaten in the ‘all prey’ treatment with no toadfish. First, the resources expected to be eaten if there was no crab-crab interactions was calculated using the multiplicative rule (Soluk 1993), which estimates multiple predator effects (the sum of the proportion of oysters consumed in each individual crab size class trial minus the product of the proportion of oysters consumed in each individual crab size class trial). The proportion of individuals expected to be eaten was then multiplied by 40 (number of oysters in each trial) and divided by the length of the trial to standardize the expected number of oysters consumed per day when crabs of all size classes were present. The estimated number of oysters eaten with all size classes present was subtracted from the actual number of oysters consumed per day in ‘no toadfish-all crab size’ treatments to estimate the number of oysters released because of interference competition. The calculated number of oysters per day released because of interference competition is included in figures as BR in the ‘no toadfish-all crab size’ treatment.
Literature cited
Brown, K. M., S. F. Keenan, and P. D. Banks. 2005. Dominance hierarchies in xanthid crabs: roles in resource-holding potential and field distributions. Marine Ecology Progress Series 291:189–196.
Grabowski, J. H. 2004. Habitat complexity disrupts predator-prey interactions but not the trophic cascade on oyster reefs. Ecology 85:995–1004.
McDonald, J. 1982. Divergent life-history patterns in the co-occurring inter-tidal crabs Panopeus-herbstii and Eurypanopeus-depressus (crustacea, brachyura, xanthidae). Marine Ecology-Progress Series 8:173–180.
Meyer, D. 1994. Habitat partitioning between the xanthid crabs Panopeus herbstii and Eurypanopeus depressus on intertidal oyster reefs (Crassostrea virginica) in southeastern North Carolina. Estuaries and Coasts 17:674–679.
Soluk, D. A. 1993. Multiple predator effects: predicting combined functional response of stream fish and invertebrate predators. Ecology 74:219–225.
Table A1. Size measurements of oysters, mud crabs, and toadfish in experiment 1 and 2. The biomass of individual mud crabs was measured during experiment 2. The biomass per size class was calculated by multiplying the average biomass in each size class to the number of crabs in the respective size class treatment. Standard error (SE) and number of individuals measured (n) are included.
|
|
Oyster |
Mud crab |
Toadfish |
||||
|
|
Small |
Medium |
Large |
Small |
Medium |
Large |
|
Experiment 1 |
Mean ± SE. |
10.9±0.3 |
12.4±0.2 |
20±0.2 |
30.5±0.4 |
198.1±8.8 |
270.4±2.5 |
321.9±4.5 |
Size (mm) |
n |
249 |
135 |
134 |
137 |
21 |
22 |
21 |
Range |
4.4-23.4 |
9-15.4 |
15.3-24.8 |
25-44.3 |
95-248 |
250-286 |
294-358 |
|
Experiment 2 |
Mean ± SE |
8.3±0.3 |
12.5±0.2 |
20±0.2 |
29.6±0.4 |
|
264.1±6.6 |
|
Size (mm) |
n |
70 |
70 |
70 |
70 |
|
24 |
|
Range |
4.4-13.4 |
9-14.9 |
16.4-24.6 |
23.4-39.5 |
|
195-313 |
|
|
Overall |
Mean ± SE |
|
12.4±0 |
19±0.1 |
30.8±0.9 |
196.8±14.3 |
375.7±16.6 |
587±41.2 |
Biomass (g) |
n |
|
122 |
157 |
61 |
23.0 |
19.0 |
19.0 |
Range |
|
0.16-2 |
0.76-6.09 |
4.45-38.26 |
62-384 |
252-551.1 |
220-934 |
|
Experiment 1 Biomass (g) |
Mean ± SE |
|
148.8±0.3 |
133±0.7 |
154±4.6 |
|
|
|
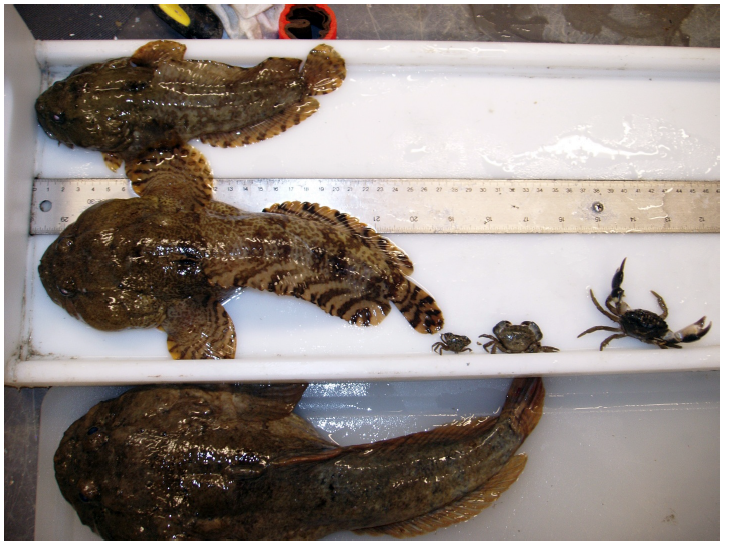
Fig. A1. Toadfish and mud crabs in each of the respective size categories.
Table A2. The variables and formulas used to calculate indirect effects (upper panel) and the experimental results (lower panel). Lower case letters denote presence of predator and upper case denotes absence of predator. Estimation of the resource release resulting from consumption of prey (ER) and the reduction in prey foraging (BE). Only calculations for treatments with all crab size classes are shown.
Predator Treatment |
Crabs eaten (crab) |
Oyster consumption (oysters·d-1) |
Standardized Oyster consumption (oysters·crab-1 ·d-1) |
Expected resource release (ER, oysters·d-1) |
Actual resource release (AR, oysters·d-1) |
Behavioral resource release (BR, oysters·d-1) |
No |
P |
M |
C |
ER=c·p |
AR=M-m |
BR=AR-ER |
Yes |
p |
m |
c |
|||
|
|
|
|
|
|
|
No |
3.33±1.36 |
1.91±0.39 |
0.09±0.02 |
0.34±0.19 |
|
|
Small |
4.33±1.43 |
0.73±0.18 |
0.04±0.01 |
0.20±0.10 |
1.18±0.31 |
0.98±0.28 |
Medium |
4.50±0.85 |
0.78±0.29 |
0.04±0.01 |
0.21±0.10 |
1.13±0.29 |
0.93±0.31 |
Large |
1.67±0.76 |
0.45±0.13 |
0.02±0.01 |
0.05±0.04 |
1.46±0.34 |
1.41±0.34 |