Ecological Archives E096-221-A3
Karen A. Stahlheber, Kimberly L. Crispin, Cassidy Anton, and Carla M. D'Antonio. 2015. The ghosts of trees past: savanna trees create enduring legacies in plant species composition. Ecology 96:25102522. http://dx.doi.org/10.1890/14-2035.1
Appendix C. Additional results describing environmental attributes affected by the tree crown and relationships with plant community composition.
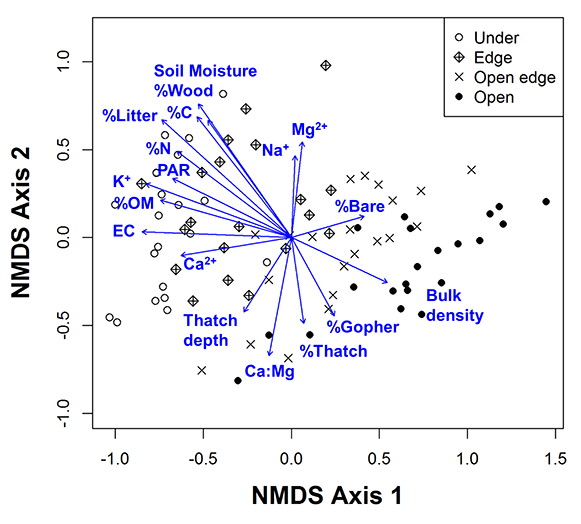
Table C1. Linear correlation of environmental vectors with Bray-Curtis dissimilarity in plant composition (2009 plant data). Axis 1 and 2 values indicate the endpoint of the vector with an origin of (0,0). See Fig. C1 for overlap with NMDS ordination plot.
Variable |
Axis 1 |
Axis 2 |
r² |
p |
Bare ground (%) |
0.9578 |
0.2874 |
0.1206 |
0.0042 |
Thatch cover (%) |
0.1360 |
-0.9907 |
0.1604 |
0.0006 |
Litter cover (%) |
-0.7334 |
0.6798 |
0.6407 |
0.0001 |
Dead wood cover (%) |
-0.5759 |
0.8176 |
0.4319 |
0.0001 |
Gopher disturbance (%) |
0.4866 |
-0.8737 |
0.1638 |
0.0010 |
Cowpie cover (%) |
-0.6965 |
-0.7176 |
0.0354 |
0.2341 |
Thatch/Litter depth (cm) |
-0.5411 |
-0.8409 |
0.1621 |
0.0008 |
PAR (% of ambient) |
-0.8903 |
0.4554 |
0.3658 |
0.0001 |
Soil Moisture (%) |
-0.5676 |
0.8233 |
0.5540 |
0.0001 |
Bulk density (g/cm3) |
0.8960 |
-0.4440 |
0.2349 |
0.0001 |
Coarse Organic Matter (%) |
-0.9601 |
0.2797 |
0.3871 |
0.0001 |
Rockiness (%) |
-0.9153 |
-0.4029 |
0.0272 |
0.3386 |
pH |
-0.9192 |
0.3938 |
0.0107 |
0.6504 |
Electroconductivity (μS/mL) |
-0.9987 |
0.0501 |
0.4647 |
0.0001 |
Total carbon (%) |
-0.6142 |
0.7892 |
0.4894 |
0.0001 |
Total nitrogen (%) |
-0.7943 |
0.6076 |
0.4285 |
0.0001 |
K+ (µg/100g) |
-0.9359 |
0.3522 |
0.5011 |
0.0001 |
Na+ (µg/100g) |
0.0490 |
0.9988 |
0.1456 |
0.0018 |
Ca2+ (µg/100g) |
-0.9905 |
-0.1373 |
0.2591 |
0.0001 |
Mg2+ (µg/100g) |
0.1146 |
0.9934 |
0.2035 |
0.0001 |
Ca:Mg ratio |
-0.1854 |
-0.9827 |
0.3053 |
0.0001 |
Table C2. Soil and light availability measurements that were significantly different around Q. agrifolia and Q. lobata when averaging all locations relative to the tree crown. Data were collected at the Mesa site. F tests and p values are from the species effect of fixed-factor linear models. For C:N Ratio, July pH and Mg, maximum likelihood tests of deviance were used in place of F tests due to non-normal model residuals.
|
Q. agrifolia |
Q. lobata |
F |
p |
% Rocks |
36.31 |
33.13 |
5.77 |
0.019 |
% Carbon |
3.07 |
2.70 |
5.23 |
0.025 |
C:N Ratio |
9.56 |
9.02 |
9.30 |
0.003 |
% Soil Moisture (May-July 2008) |
5.49 |
4.25 |
19.20 |
< 0.001 |
% Soil Moisture (March 2010) |
10.49 |
12.21 |
4.81 |
0.038 |
pH (March 2010) |
4.56 |
4.83 |
6.19 |
0.020 |
Mg2+ (meq/100g) |
4.58 |
3.30 |
5.23 |
0.025 |
PAR, % of ambient (Apr 2009) |
53.74 |
64.71 |
16.53 |
< 0.001 |
Table C3. Soil properties around living and dead trees at the Mesa site. The three locations were always significantly different, but the location effect rarely differed between living and dead trees. F statistics and p values are from the Tree Type * Location interaction term of a fixed-factor least squares linear model. Lower case letters indicate means that are significantly different according to a Tukey HSD post-hoc test.
|
|
Under |
Edge |
Open |
F |
p |
% Coarse OM |
Living |
1.42a |
0.79a |
0.12b |
10.73 |
< 0.002 |
Dead |
0.93a |
0.22b |
0.21b |
|||
% Carbon |
Living |
3.66a |
2.92ab |
2.00b |
1.13 |
0.33 |
Dead |
3.40a |
2.37b |
2.17b |
|||
% Nitrogen |
Living |
0.38a |
0.32ab |
0.26b |
2.01 |
0.15 |
Dead |
0.31ab |
0.26b |
0.24b |
|||
% Soil Moisture |
Living |
6.79a |
5.57a |
3.33b |
2.33 |
0.10 |
Dead |
6.53a |
5.15ab |
4.94ab |
|||
Electroconductivity (μS/mL) (May–Jul) |
Living |
56.80a |
38.00b |
24.09c |
1.02 |
0.36 |
Dead |
64.87a |
38.47b |
33.30bc |
|||
Bulk Density (g/cm3) |
Living |
0.96ab |
0.92b |
1.06ab |
1.46 |
0.24 |
Dead |
0.94ab |
1.06ab |
1.12a |
Fig. C1. NMDS of Bray-Curtis dissimilarity matrix of survey plots, illustrating relationships between plant community composition (2009 data) and environmental variables at the Mesa site. Location types are shown by the different styles of points. Final stress of four-dimensional, convergent solution = 0.111 after 8 iterations. Blue vectors indicate environmental vectors with a significant linear relationship with NMDS scores of the plots generated by the envfit function in vegan (p > 0.05); the length of the arrow is proportional to the strength of this effect (r²). See Table C1 for details on vectors.