Ecological Archives E096-221-A1
Karen A. Stahlheber, Kimberly L. Crispin, Cassidy Anton, and Carla M. D'Antonio. 2015. The ghosts of trees past: savanna trees create enduring legacies in plant species composition. Ecology 96:25102522. http://dx.doi.org/10.1890/14-2035.1
Appendix A. Detailed methodologies for field surveys and oak wood identification.
Appendix A.1 Soil lab procedures:
First, gravimetric soil moisture was determined for subsamples taken from all soil cores. Whole cores were air-dried, and weighed to calculate bulk density. Next, we ground and sieved each core to determine the percent rocks and coarse organic material (>2 mm) by weight. We measured soil pH using an Orion AquaPro 9156APWP electrode (Thermo Scientific Inc) and electroconductivity (µS/mL) was tested using an ECTestr 11+ (Eutech/Oakton Instruments). Both pH and electroconductivity were determined on a 3:1 (water:soil) slurry with air-dried soils. Total carbon and nitrogen were measured using a NA 1500 Series 2 analyzer (Fisons Instruments, Beverly MA). Lastly, we sent a subset of samples from around living trees to the University of California Davis Analytical Lab for measurements of exchangeable K, Na, Ca, and Mg cations.
Appendix A.2 Oak wood identification:
Tree cores were sectioned with razor blades into pieces including both early and late wood. These thin sections of oak wood were macerated at 55°C for one week in a solution of 5 parts glacial acetic acid, 1 part 30% hydrogen peroxide and 4 parts distilled water, changing the maceration solution once mid-week (Franklin 1945; Wilson 1964). Individual cells were gently separated on slides in a glycerol solution with dissecting needles. We used Safranin dye to enhance the contrast before photographing vessels. For each tree, we prepared 5 slides of cells and on each slide vessels were photographed individually at 125x magnification using a Zeiss Ultraphot compound light microscope equipped with a DVC digital camera (approx. 75–100 vessels per tree). We then used ImageJ to measure each vessel’s width and length (Table A2).
Table A1. Soil type and survey information for three sites sampled within Sedgwick Reserve. The ‘Months’ column indicates the timing of the vegetation composition surveys, soil cores and light measurements. The years and sites in which soil cores were collected are indicated with an X. Soil series and taxonomy information from county-level surveys by Shipman (1972).
Site |
USDA Soil Series and Taxonomy |
Year |
Months |
Number and type of trees |
Soils |
Mesa |
POSITAS – Fine, smectitic, thermic Mollic Palexeralfs |
2008 |
March – May |
11 living Q. agrifolia 10 living Q. lobata |
X |
2009 |
March – May |
11 living Q. agrifolia 10 living Q. lobata 6 standing dead trees |
|
||
2010 |
March – May |
6 living Q. agrifolia 6 living Q. lobata 9 standing dead trees |
X |
||
Figueroa |
SALINAS – Fine-loamy, mixed, superactive, thermic Pachic Haploxerolls |
2011 |
July – August |
1 living Q. agrifolia 3 living Q. douglasii 6 living Q. lobata 10 standing dead trees 10 cut dead trees |
|
Lisque |
BOTELLA – Fine-loamy, mixed, superactive, thermic Pachic Argixerolls ELDER – Coarse-loamy, mixed, superactive, thermic, Cumulic Haploxerolls |
2011 |
July – August |
6 living Q. douglasii 4 living Q. lobata 10 standing dead trees 10 removed dead trees |
|
Table A2. Quantiles for vessel element attributes of samples from three species of living trees and a possible hybrid. Units are arbitrary, calculated by assigning a width of 2 to the magnified field of view in ImageJ. Q. douglasii and the hybrid tree’s vessels are significantly shorter than the other species (χ2 = 78.57, df = 3, p < 0.001). Vessel width was distinct within each species (χ2 = 162.75, df = 3, p < 0.001): Q. agrifolia had the largest median vessel size, Q. douglasii next largest, and Q. lobata the smallest median size. The hybrid tree was intermediate between Q. agrifolia and Q. douglasii. Units are arbitrary, calculated by assigning a width of 2 to the magnified field of view in ImageJ.
|
Q. agrifolia (n = 5 oaks) (n = 282 vessels) |
Q. douglasii (n = 6 oaks) (n = 486 vessels |
Q. lobata (n = 5 oaks) (n = 327 vessels) |
Possible douglasii × lobata (n = 1 oak) (n = 76 vessels) |
|
Vessel length |
Min |
0.329 |
0.213 |
0.273 |
0.207 |
10% |
0.488 |
0.389 |
0.471 |
0.444 |
|
25% |
0.589 |
0.479 |
0.557 |
0.524 |
|
Median |
0.688 |
0.566 |
0.663 |
0.584 |
|
75% |
0.788 |
0.670 |
0.768 |
0.698 |
|
90% |
0.877 |
0.758 |
0.865 |
0.761 |
|
Max |
1.123 |
1.018 |
1.205 |
0.920 |
|
|
|
|
|
|
|
Vessel diameter |
Min |
0.100 |
0.100 |
0.100 |
0.114 |
10% |
0.137 |
0.132 |
0.111 |
0.152 |
|
25% |
0.249 |
0.194 |
0.130 |
0.188 |
|
Median |
0.428 |
0.259 |
0.159 |
0.282 |
|
75% |
0.563 |
0.362 |
0.245 |
0.546 |
|
90% |
0.686 |
0.481 |
0.555 |
0.733 |
|
Max |
0.954 |
0.690 |
1.219 |
0.861 |
|
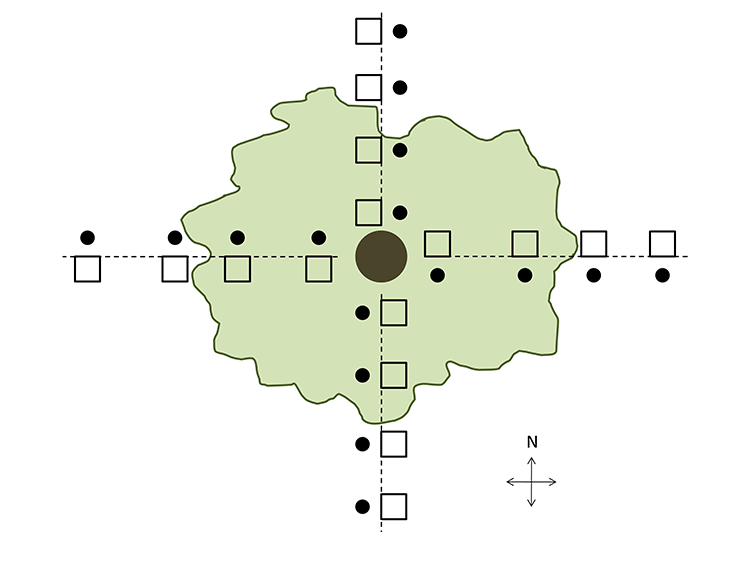
Fig. A1. Sampling method used at each surveyed tree at Mesa. Transects were oriented to azimuths of 0, 90, 180, and 270° relative to true north. Placement of quadrats along the transects not to scale but reflective of the location type surveyed. Squares indicate 1 × 1 m vegetation survey plots and circles represent soil cores. At Lisque and Figueroa we used a similar survey design, but only transects of 0° and 180° were used and no soil samples were collected.
Literature cited
Franklin, G. L. 1945. Preparation of thin sections of synthetic resins and wood-resin composites, and a new macerating method for wood. Nature: 51.
Shipman, G. E. 1972. Soil survey of northern Santa Barbara area, California. United States Department of Agriculture, Soil Conservation Service, California Agricultural Experiment Station.
Wilcox, W. W. 1964. U.S. Forest Service Research Note FPL-056: Preparation of decayed wood for microscopical examination. U.S. Depatment of Agriculture, Forest Products Laboratory, Madison, Wisconsin, USA.