Ecological Archives E096-216-A4
Cayetano Gutiérrez-Cánovas, David Sánchez-Fernández, Josefa Velasco, Andrés Millán, and Núria Bonada. 2015. Similarity in difference: changes in community functional features along natural and anthropogenic stress gradients. Ecology 96:24582466. http://dx.doi.org/10.1890/14-1447.1
Appendix D. Procedure used to calculate functional niche features.
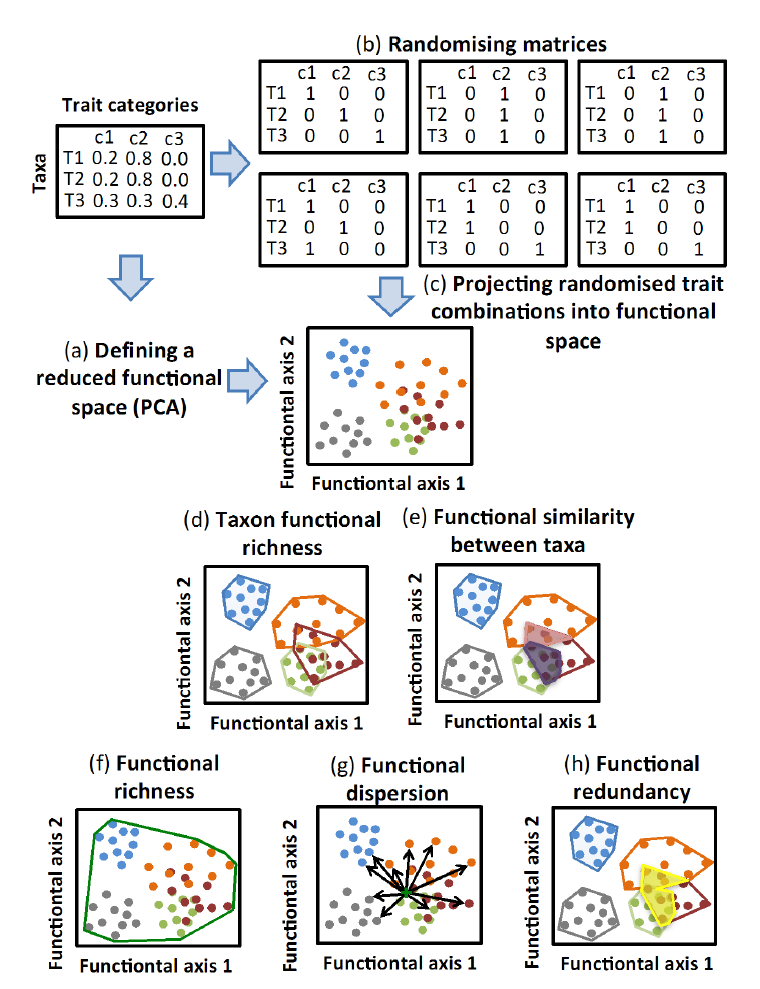
First, we performed a principal components analysis (PCA) using the taxa × traits matrix to obtain a set of uncorrelated axes that represent the variability of the trait categories contained in the raw matrix (Fig. D1a). To do this, we selected the significant axes resulting from applying the "Broken Stick rule" (Jackson 1993). We retained the first four axes in both data sets, representing 90.2% and 90.1% of the variance for the Salinity and Land-use trait datasets, respectively. These axes constituted the dimensions of the functional space in which we quantified functional measures. Second, we built several simulated binary matrices with one category per trait, following a random sampling based on the probability that each category be present in a randomly generated, simulated individual belonging to that genus (i.e., trait fuzzy code profile, expressed as a percentage of occurrence) (Fig. D1b). These matrices were projected onto the generated functional space to create clouds of points that simulate the suite of potential trait combinations that comprise inter- and intra-genus functional variability (Fig. D1c). This procedure was repeated several times to produce between 3 to 2000 points per genus for examining potential asymptotic behavior along this gradient. We selected the minimum number of simulated points that achieved a Pearson correlation coefficient of R≥0.95 using the functional niche descriptors calculated with 2000 points per taxon (assumed as a sufficient number to represent the full within-genus variability). In our case, 25 simulated points were enough to reach the proposed criteria in both data sets. Finally, once we obtained points representing the different trait combinations in each community and a defined functional space, we calculated taxon functional richness, functional similarity between taxa, community functional richness, and community functional redundancy as the areas between pairs of axes and community functional dispersion as the average distance to the community centroid for each pair of axes (Laliberté and Legendre 2010). We estimated the taxon niche as the functional space filled by all the simulated points projected for all axis pairs, representing the taxon functional richness (Fig D1d). Mean taxon functional richness was estimated as the average of the taxon functional richness of each community. Functional similarity between taxa was obtained by averaging the percentage of inter-taxon niche overlap for all taxon pairs in each axis pair for each community (Fig. D1e). Functional richness was estimated as the functional space filled by the points of all of the taxa present at each community for all axis pairs (Fig. D1f). Functional dispersion (Laliberté and Legendre 2010) was estimated by averaging the Euclidean distance from each simulated point to the community centroid (Fig. D1g). Functional redundancy was calculated as the sum of the overlapping niche regions for all taxon pairs in each axis pair at each site (Fig. D1h). This is a new approach to measure functional redundancy that eliminates the necessity of making a previous functional classification of data, which may involve information loss (Villéger et al. 2008).
Literature cited
Laliberté, E., and Legendre, P. 2010. A distance-based framework for measurin functional diversity from multiple traits. Ecology 91:299–305.
Jackson, D. A. 1993. Stopping rules in principal component analysis: a comparison of heuristical and statistical approaches. Ecology 74:2204–2214.
Villéger, S., N. W. H. Mason, and D. Mouillot. 2008. New multidimensional functional diversity indices for a multifaceted framework in functional ecology. Ecology 89:2290–2301.
Fig. D1. Procedure used to calculate functional niche features.
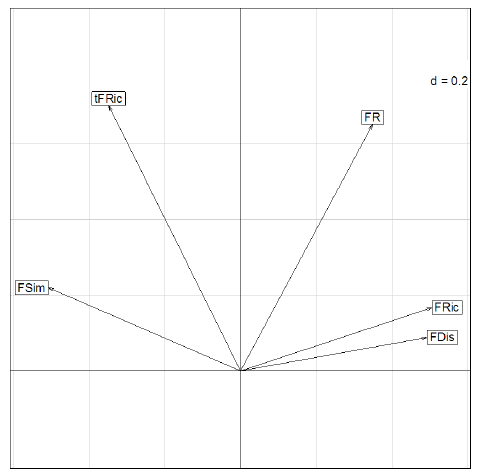
To assess the relationship among the taxon and community level functional features, we perform a Principal Component Analysis based on the functional variables of the two datasets, n = 207 (Salinity, n = 105 and Land-use, n = 102). The first two principal components explained the 90.3% of the variance. PC1 showed relationship with functional similarity between taxa, community functional richness and community functional dispersion, and in a lesser extend with mean taxon functional richness and community functional redundancy (Fig. D2 and Table D1). PC2 was related only with mean taxon functional richness and community functional redundancy. Mean taxon functional richness (tFRic); Functional similarity between taxa (FSim); Community functional richness (FRic); Community functional dispersion (FDis); Community functional redundancy (FR).
Fig. D2. PCA on the functional attributes merging the results of both data sets (Saliniy+Land-use), n = 207.
Table D1. Pearson correlations between functional features and Principal Components.
Functional feature |
PC1 |
PC2 |
Mean taxon functional richness |
-0.65 |
0.71 |
log - Functional similarity between taxa |
-0.95 |
0.22 |
Community functional richness |
0.94 |
0.17 |
Community functional dispersion |
0.92 |
0.09 |
log - Community functional redundancy |
0.65 |
0.66 |