Ecological Archives E096-215-A1
Elizabeth H. Schultheis, Andrea E. Berardi, and Jennifer A. Lau. 2015. No release for the wicked: enemy release is dynamic and not associated with invasiveness. Ecology 96:24462457. http://dx.doi.org/10.1890/14-2158.1
Appendix A. Tables giving all experimental species and detailed information on their status, seed origin, years planted into the experiment, and GenBank accession numbers, results from phylogenetic generalized least squares (PGLS) ANOVA testing the effects of plant status (native, non-invasive exotic, or invasive) and phylogeny on insect herbivory and mammal browsing, results from ANCOVA testing the effects of plant status and geographic spread (at three spatial scales) or time on herbivory and browsing, and a figure giving the best scoring ML phylogenetic tree.
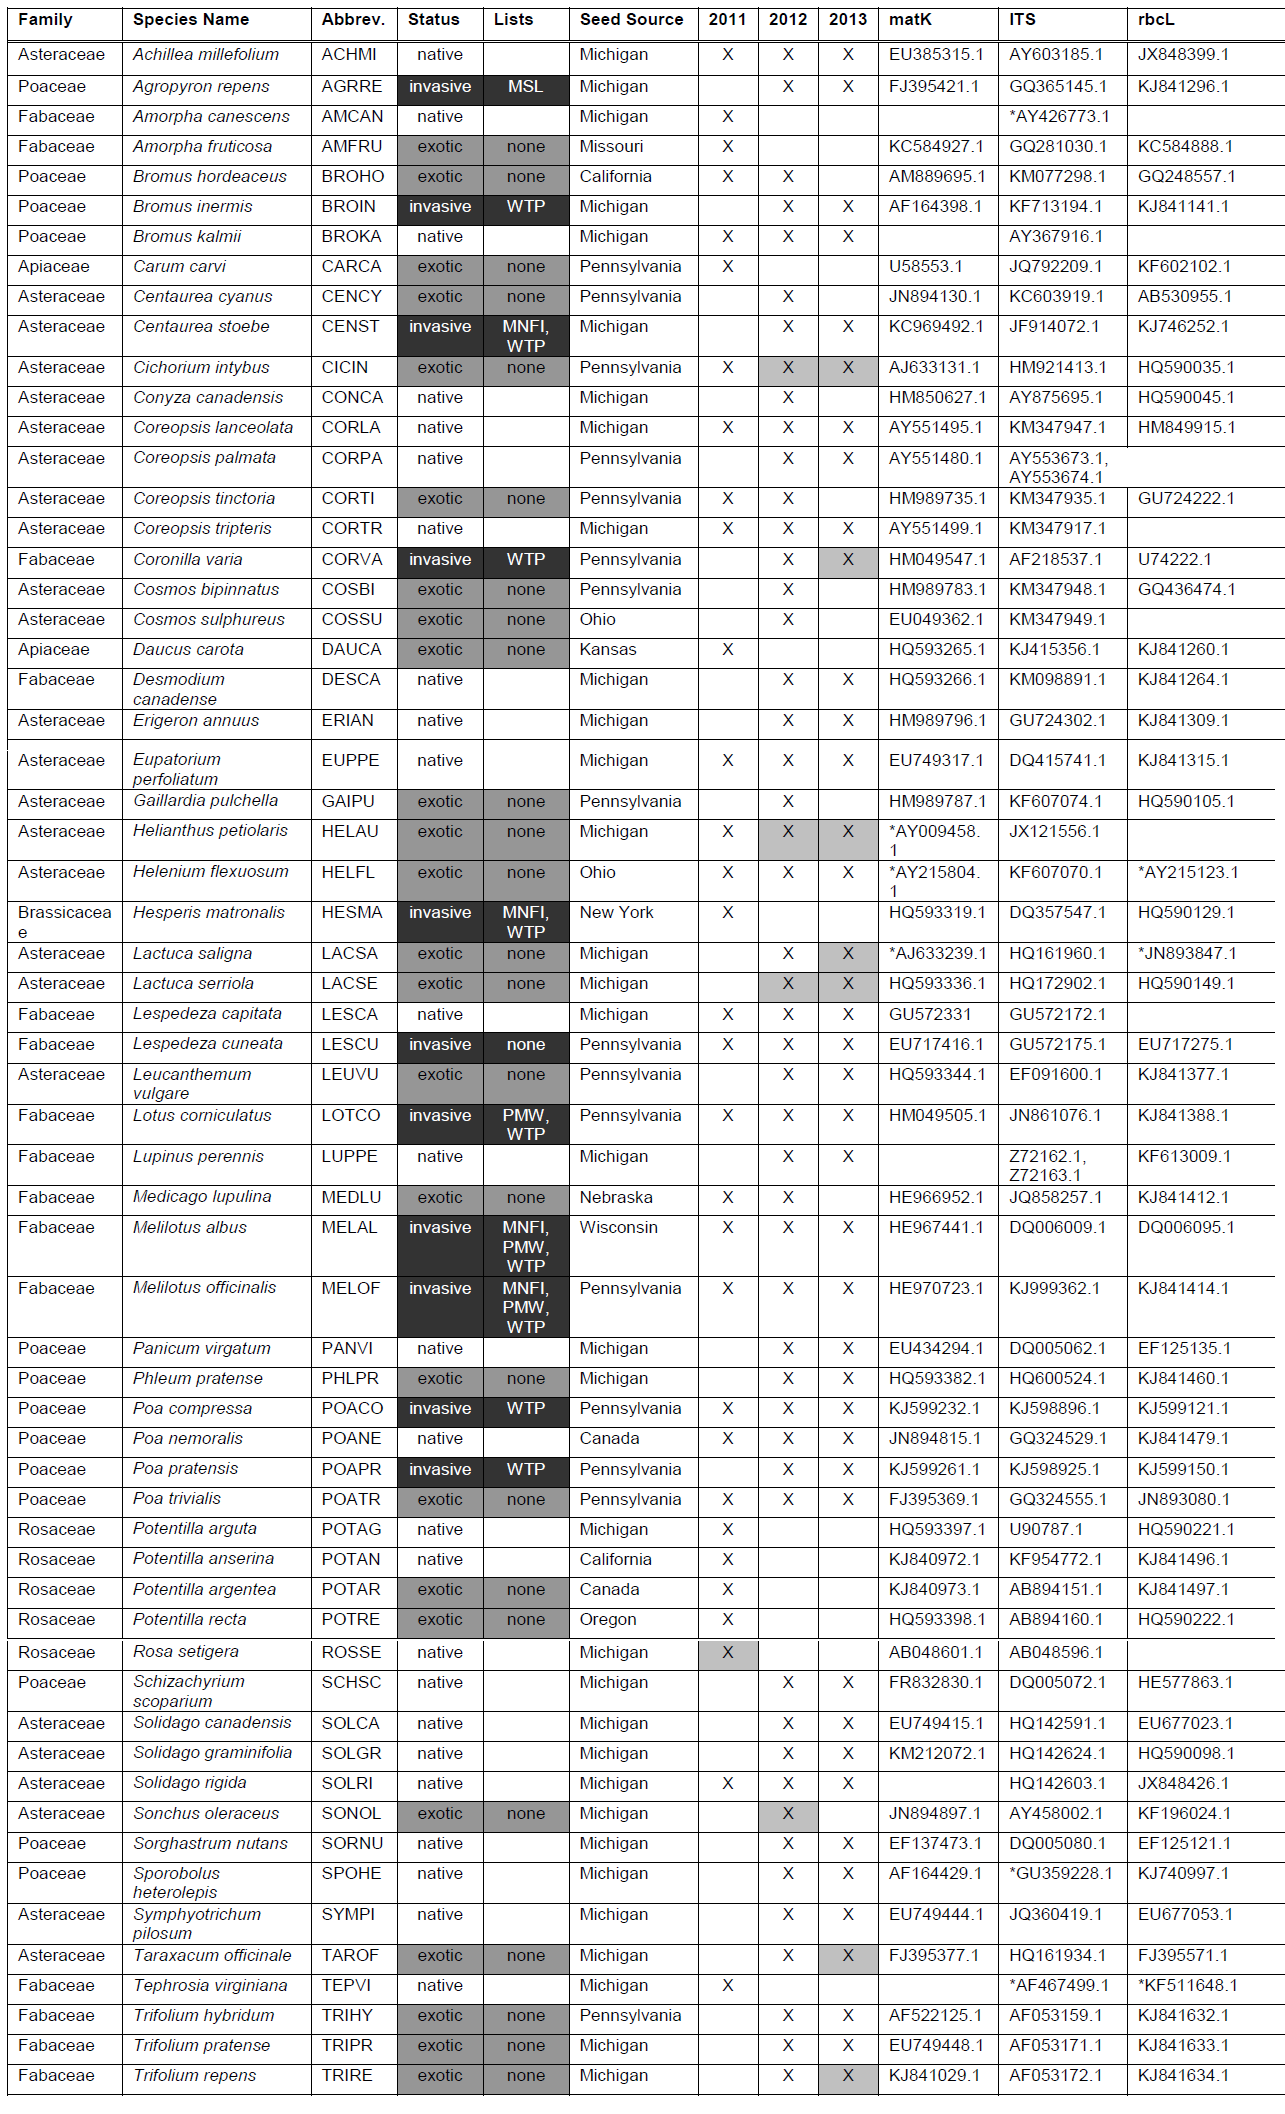
Table A1. List of the 61 species planted into the 2011 and 2012–2013 common gardens. Species are color coded by plant status: native (white), exotic (gray), and invasive (black). In the columns for year, presence of a particular species is indicated with an ‘X’. If the cell is grayed out, it indicates that survival was low and the species was not included in the analysis for that year. GenBank accession numbers of genes used for phylogeny construction are listed. When a species was not located in GenBank, a close relative was used and noted with (*).
Table A2. Results from phylogenetic generalized least squares (PGLS) analysis of variance (ANOVA) testing the effects of plant status (native, non-invasive exotic, or invasive) and phylogeny on insect herbivory and mammal browsing. Statistically significant (P < 0.05) effects are in bold.
|
|
|
2011 |
|
2012 |
|
2013 |
||||||
|
Source |
|
df |
F |
P |
|
df |
F |
P |
|
df |
F |
P |
|
|
|
|
|
|
|
|
|
|
|
|
|
|
(a) Insect Herbivory ANOVA |
|
|
|
|
|
|
|||||||
|
Status |
|
2,27 |
2.20 |
0.04 |
|
1, 2 |
4.23 |
0.02 |
|
1, 2 |
0.51 |
0.35 |
|
|
|
|
|
|
|
|
|
|
|
|
|
|
(b) Mammal Browser ANOVA |
|
|
|
|
|||||||||
|
Status |
|
1, 2 |
2.07 |
0.15 |
|
1, 2 |
2.52 |
0.09 |
|
1, 2 |
3.09 |
0.06 |
Table A3. Results from analysis of covariance (ANCOVA) testing the effects of plant status (native, non-invasive exotic, or invasive) and geographic spread (at three spatial scales) or time on insect herbivory and mammal browsing. Statistically significant (P < 0.05) effects are in bold.
|
|
|
|
|
|
|
|
|
|
|
|
|
|
|
|
|
|
|
|
|||
|
|
|
MI Spread |
|
Five State Spread |
|
US Spread |
|
|
|
Time |
|
|
|||||||||
|
Source |
|
df |
χ2 |
P |
|
df |
χ2 |
P |
|
df |
χ2 |
P |
|
Source |
df |
χ2 |
P |
||||
|
|
|
|
|
|
|
|
|
|
|
|
|
|
|
|
|
|
|
|
|||
(a) Insect Herbivory ANCOVA |
|
|
|
|
|
|
|
|
|
|
|
|
|
|
|
|
||||||
|
Status |
|
1, 30 |
1.99 |
0.24 |
|
1, 30 |
1.64 |
0.16 |
|
1, 30 |
2.08 |
0.29 |
|
Status |
1, 30 |
2.40 |
0.08 |
||||
|
County |
|
1, 31 |
2.04 |
< 0.001 |
|
1, 31 |
1.74 |
< 0.001 |
|
1, 31 |
2.16 |
0.001 |
|
Residence Time |
1, 31 |
2.57 |
0.02 |
||||
|
Status × County |
|
1, 29 |
0.17 |
0.04 |
|
1, 29 |
1.58 |
0.28 |
|
1, 29 |
2.04 |
0.42 |
|
Status × Time |
1, 29 |
1.76 |
< 0.001 |
||||
|
|
|
|
|
|
|
|
|
|
|
|
|
|
|
|
|
|
|
|
|||
(b) Mammal Browser ANCOVA |
|
|
|
|
|
|
|
|
|
|
|
|
|
|
|
|
||||||
|
Status |
|
1, 30 |
9.52 |
0.22 |
|
1, 30 |
10.14 |
0.34 |
|
1, 30 |
10.52 |
0.40 |
|
Status |
1, 30 |
9.72 |
0.59 |
||||
|
County |
|
1, 31 |
9.88 |
0.04 |
|
1, 31 |
10.34 |
0.10 |
|
1, 31 |
10.67 |
0.24 |
|
Residence Time |
1, 31 |
9.82 |
0.06 |
||||
|
Status × County |
|
1, 29 |
7.83 |
0.009 |
|
1, 29 |
5.43 |
< 0.001 |
|
1, 29 |
5.86 |
< 0.001 |
|
Status × Time |
1, 29 |
9.18 |
0.20 |
||||
|
|
|
|
|
|
|
|
|
|
|
|
|
|
|
|
|
|
|
|
|||
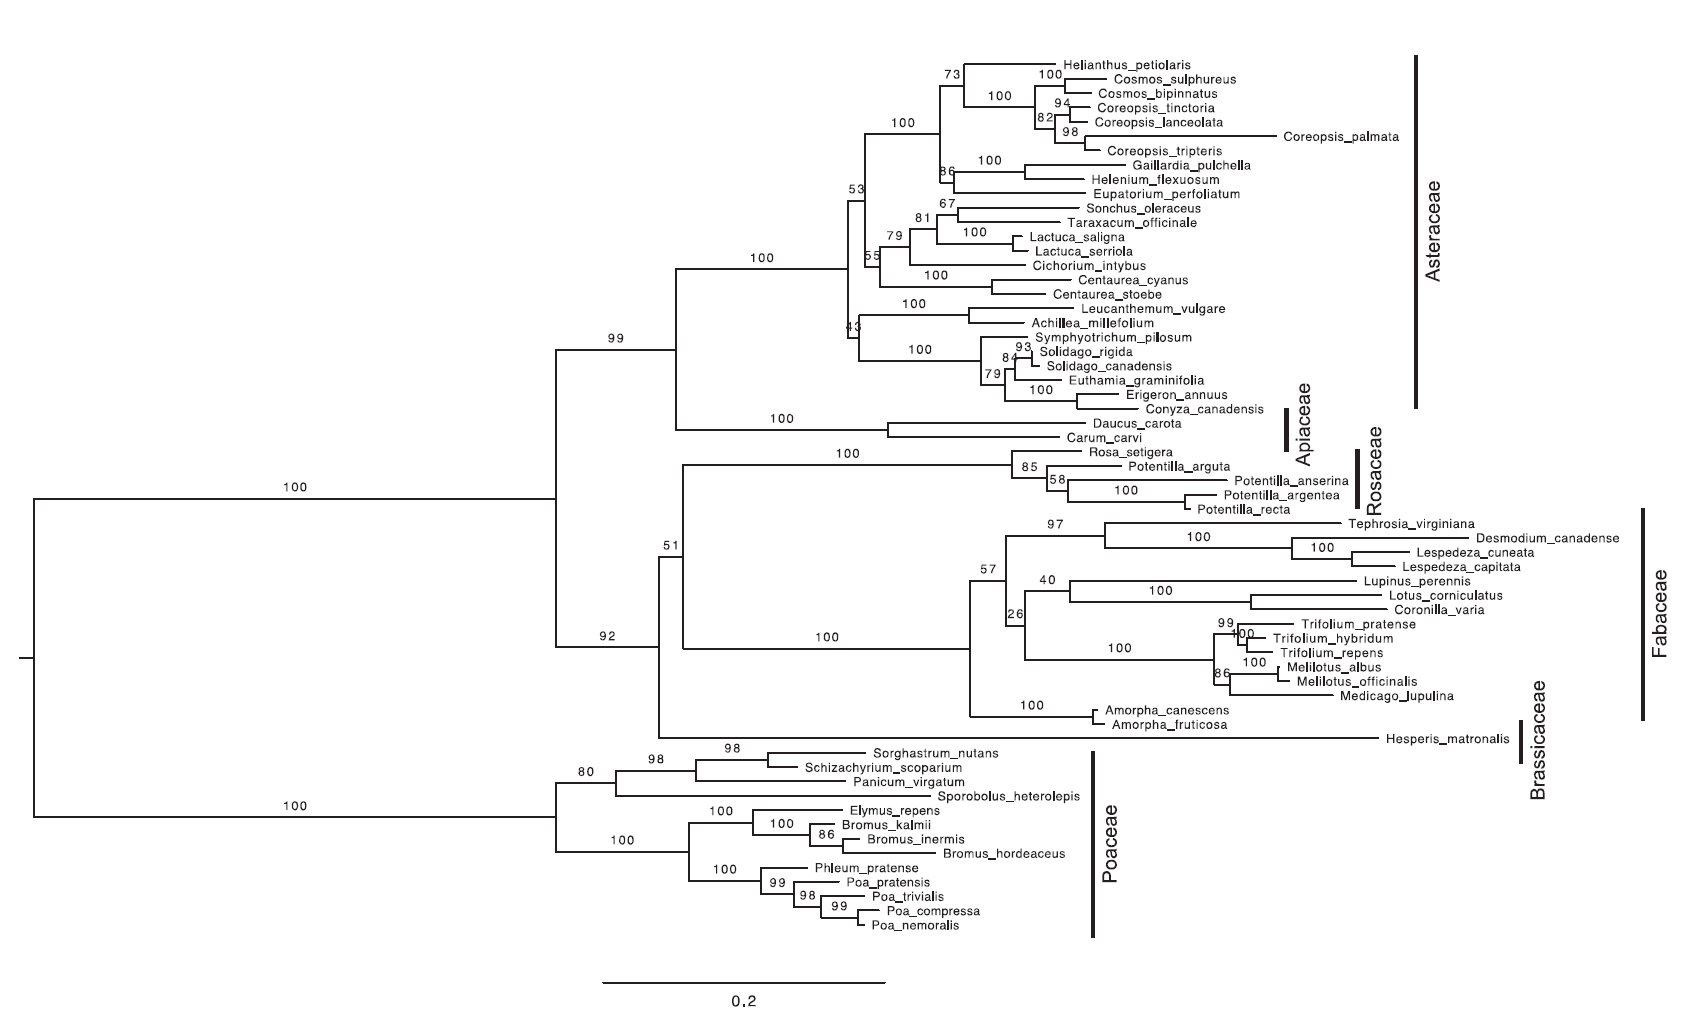
Fig. A1. The best-scoring ML tree from a rapid bootstrap analysis in RAxML from the analysis of the concatenated sequences of matK, ITS, and rbcL. ML bootstrap frequencies are the numbers associated with nodes, and branch legths are proportional to the number of nucleotide changes.