Ecological Archives E096-208-A1
Brian C. Hong and Jonathan B. Shurin. 2015. Latitudinal variation in the response of tidepool copepods to mean and daily range in temperature. Ecology 96:23482359. http://dx.doi.org/10.1890/14-1695.1
Appendix A. Geographic variation in T. californicus life history response to temperature.
Table A1. Results of model averaging procedure to predict each of the five life history traits and r. The parameter estimates are the averages from the five best fit reduced models, and the importance is calculated as the sum of the Akaike weights over all of the models in which the parameter of interest appears. Analysis was performed using the “dredge” routine in the R package “MuMIn”.
Trait |
Coefficient |
Estimate |
Std. Error |
p-value |
Importance |
Juvenile survival |
Intercept |
37.8 |
13.9 |
0.007 |
|
|
Latitude |
-0.76 |
0.36 |
0.03 |
1 |
|
Temp |
-2.15 |
1.30 |
0.10 |
1 |
|
Temp2 |
0.04 |
0.03 |
0.12 |
1 |
|
Lat*temp |
0.76 |
0.03 |
0.01 |
0.95 |
|
Lat*temp2 |
-0.002 |
0.0007 |
0.009 |
0.98 |
Juvenile growth |
Intercept |
61.1 |
28.9 |
0.03 |
|
|
Latitude |
-3.44 |
0.74 |
<0.001 |
1 |
|
Temp |
-7.09 |
2.72 |
0.009 |
1 |
|
Temp2 |
0.17 |
0.06 |
0.005 |
1 |
|
Lat*temp |
0.40 |
0.07 |
<0.001 |
1 |
|
Lat*temp2 |
-0.01 |
0.002 |
<0.001 |
1 |
Adult survival |
Intercept |
124.1 |
28.8 |
<0.001 |
|
|
Latitude |
-0.95 |
0.54 |
0.08 |
1.0 |
|
Temp |
-3.10 |
2.29 |
0.18 |
0.70 |
|
Temp2 |
-0.027 |
0.09 |
0.77 |
0.46 |
|
Lat*temp |
0.008 |
0.057 |
0.88 |
0.14 |
|
Lat*temp2 |
3.3x10⁻⁴ |
1.5x10⁻³ |
0.83 |
0.08 |
Maturity |
Intercept |
219.0 |
54.2 |
<0.001 |
|
|
Latitude |
-2.1 |
1.4 |
0.13 |
1.0 |
|
Temp |
-15.3 |
6.0 |
0.01 |
1.0 |
|
Temp2 |
0.28 |
0.16 |
0.08 |
1.0 |
|
Lat*temp |
0.16 |
0.16 |
0.32 |
0.72 |
|
Lat*temp2 |
-0.002 |
0.005 |
0.75 |
0.55 |
Lifetime fecundity |
Intercept |
-194.7 |
330.3 |
0.56 |
|
|
Latitude |
-2.97 |
8.37 |
0.72 |
0.77 |
|
Temp |
50.4 |
35.4 |
0.16 |
1.0 |
|
Temp2 |
-1.50 |
0.95 |
0.12 |
1.0 |
|
Lat*temp |
0.309 |
1.72 |
0.86 |
0.2 |
|
Lat*temp2 |
-0.008 |
0.046 |
0.87 |
0.2 |
r |
Intercept |
3.79 |
2.19 |
0.08 |
|
|
Latitude |
-0.48 |
0.06 |
<0.001 |
1.0 |
|
Temp |
-0.61 |
0.25 |
0.02 |
1.0 |
|
Temp2 |
0.03 |
0.007 |
<0.001 |
1.0 |
|
Lat*temp |
0.07 |
0.006 |
<0.001 |
1.0 |
|
Lat*temp2 |
-0.002 |
0.0002 |
<0.0001 |
1.0 |
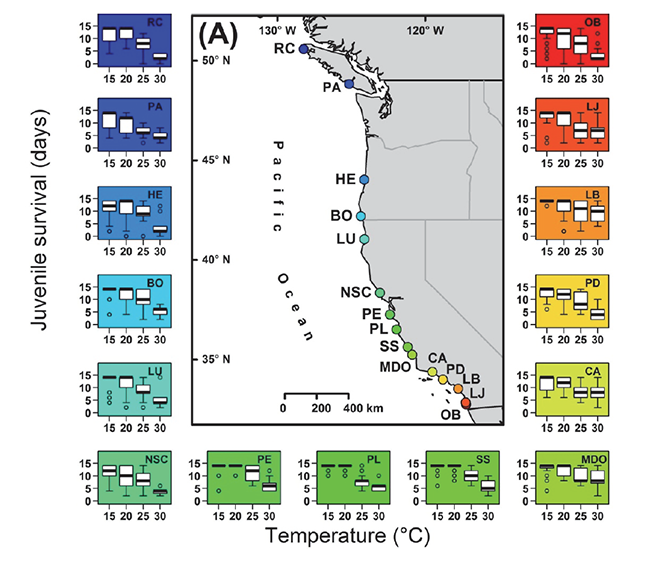
Fig. A1. Juvenile survival at each of four experimental temperatures for 15 populations of Tigriopus californicus.
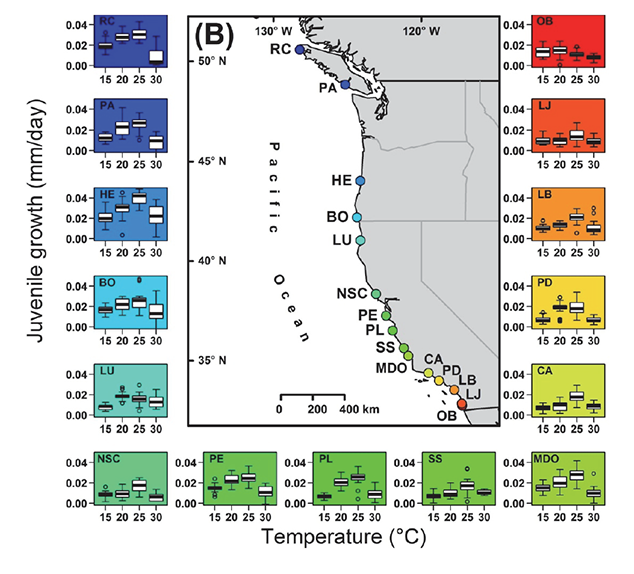
Fig. A2. Juvenile growth rate at each of four experimental temperatures for 15 populations of Tigriopus californicus.
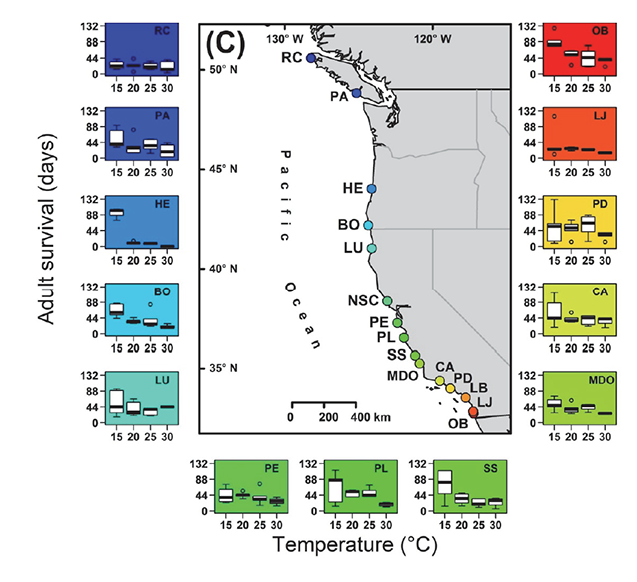
Fig. A3. Adult survival at each of four experimental temperatures for 15 populations of Tigriopus californicus.
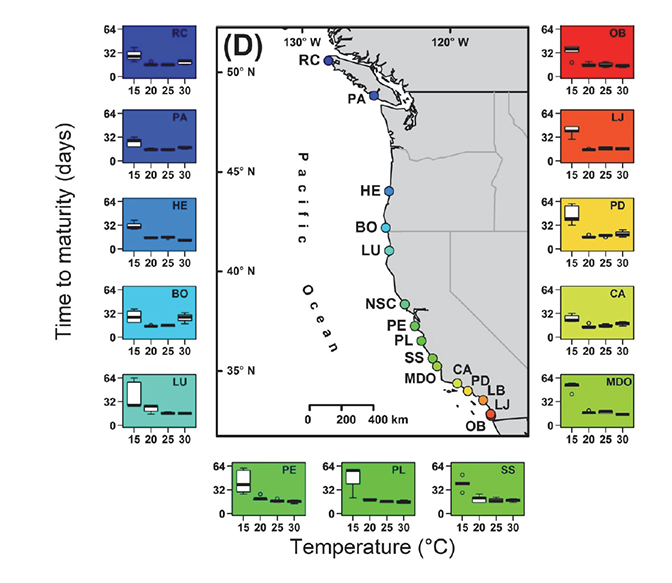
Fig. A4. Days to sexual maturity at each of four experimental temperatures for 15 populations of Tigriopus californicus.
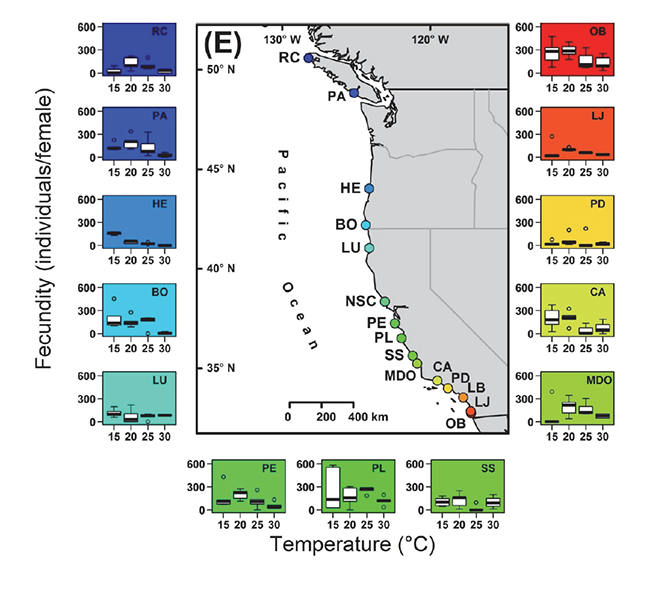
Fig. A5. Lifetime fecundity at each of four experimental temperatures for 15 populations of Tigriopus californicus.