Ecological Archives E096-207-A1
Holly V. Moeller, Ian A. Dickie, Duane A. Peltzer, and Tadashi Fukami. 2015. Mycorrhizal co-invasion and novel interactions depend on neighborhood context. Ecology 96:23362347. http://dx.doi.org/10.1890/14-2361.1
Appendix A. Figures showing sampling locations (Fig. A1), seedling root system size as a function of age (Fig. A2), and the rank-abundance distributions of fungi (Figs. A3A5).
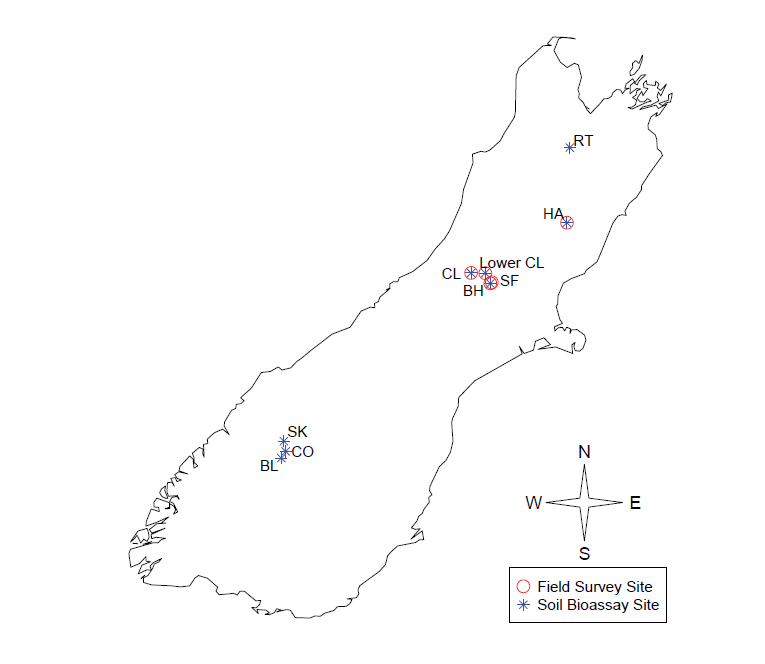
Fig. A1. Map of the South Island of New Zealand, showing sampling locations for the Field Survey (red circles) and Soil Bioassay (blue stars). Site abbreviations are BH = Bridge Hill, BL = Ben Lomond, CL = Cora Lynn, CO = Coronet, HA = Hanmer, RT = Route 63, SF = Ski Field Road, SK = Skippers Canyon.
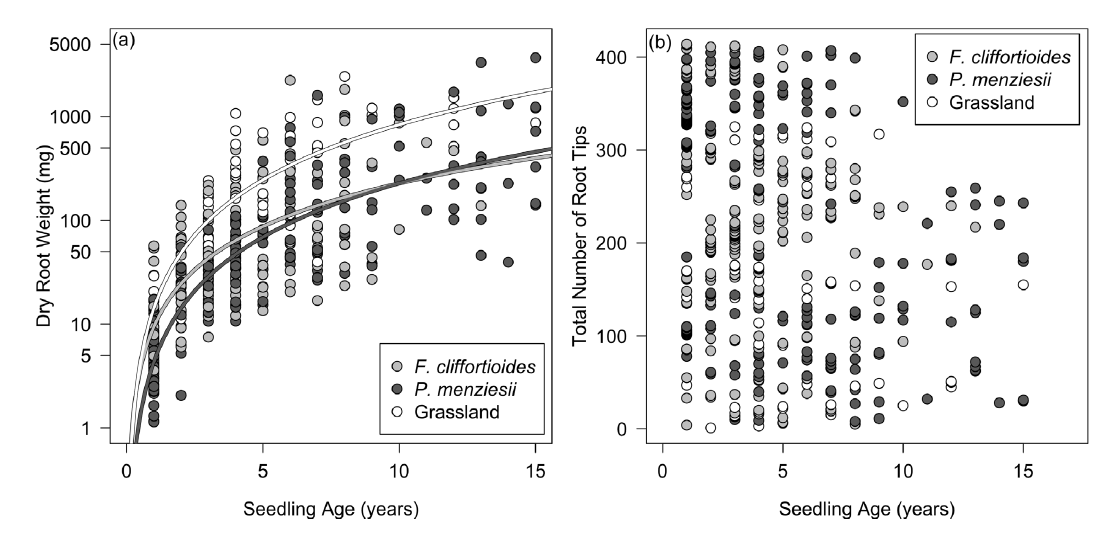
Fig. A2. Seedling root system size as a function of age, for field survey collected P. menziesii seedlings. (a) Seedling dry root mass increased with age, and the rate of increase depended upon neighborhood context (best linear model: dry weight ~ age * context, P < 0.001, R² = 0.6717). Lines show model fits for F. cliffortioides (gray), P. menziesii (black), and grassland (white) contexts. (b) Seedling root tip number exhibited no change with seedling age.
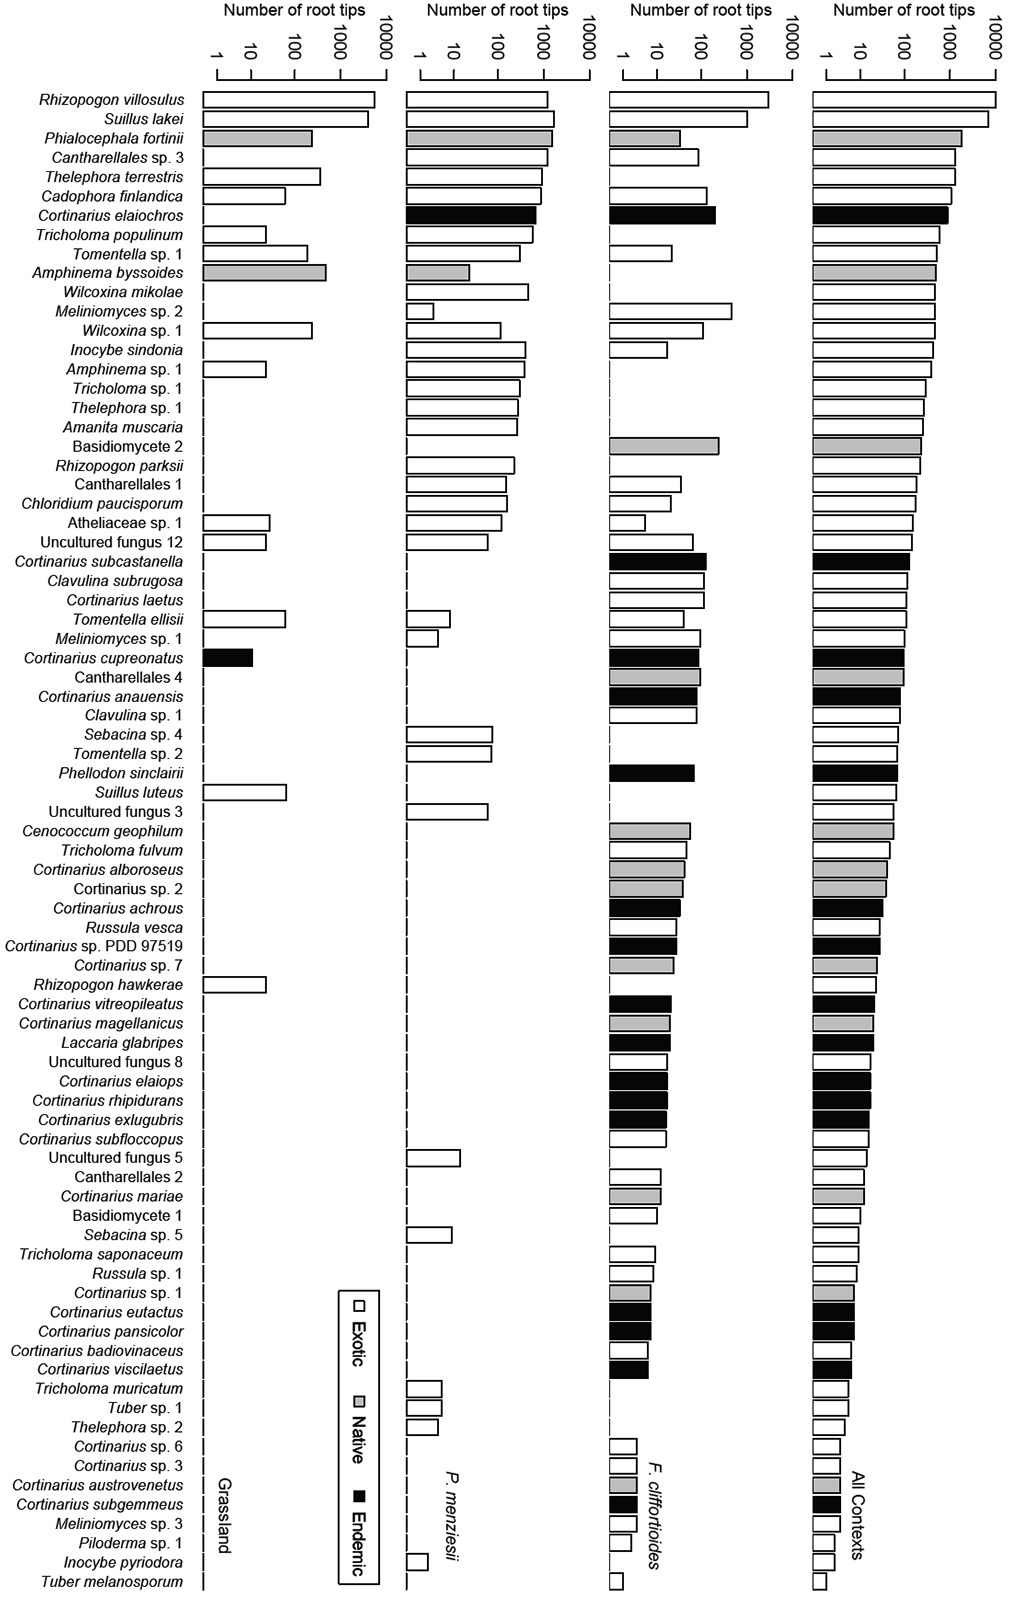
Fig. A3. Rank-abundance diagrams for fungal taxa found during the field survey. The top panel shows cumulative counts of mycorrhizal root tips across all contexts, and the following panels show abundance in F. cliffortioides, P. menziesii and grassland contexts, respectively. Bar color indicates whether fungi were exotic (white), native (believed to exist in New Zealand prior to human introductions; gray), or endemic (believed to occur only in New Zealand; black).
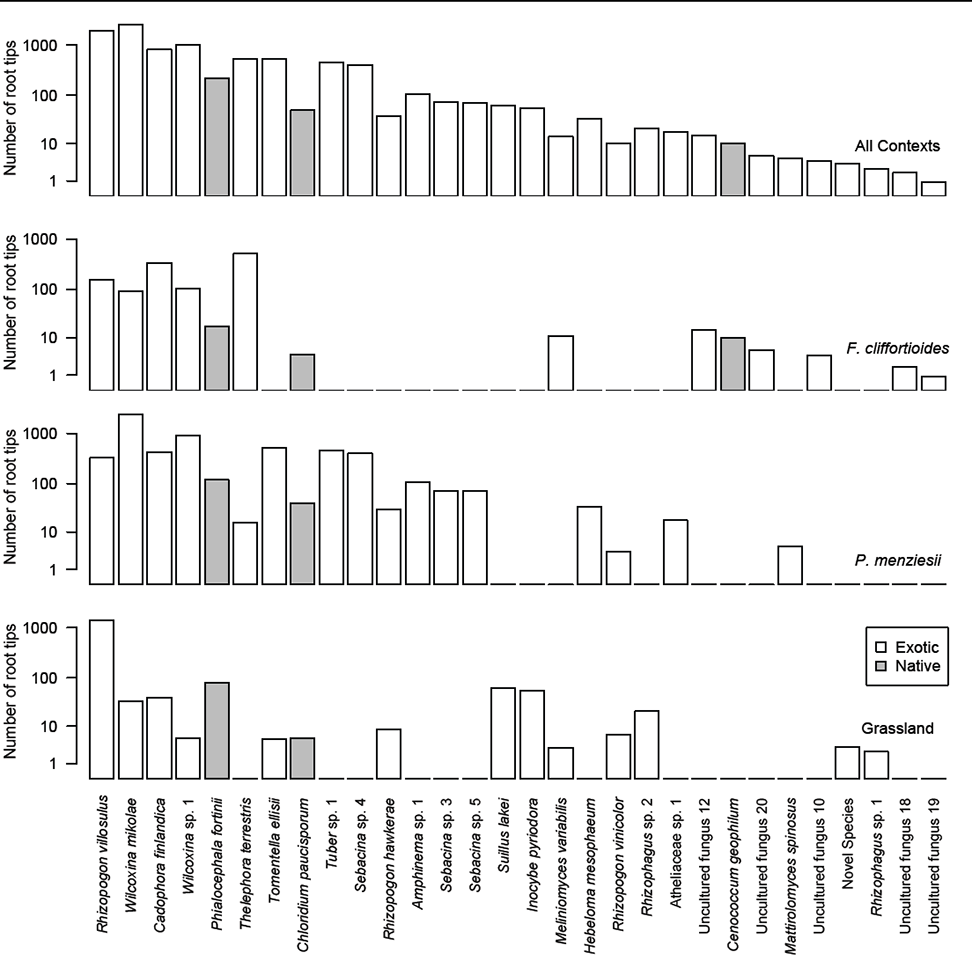
Fig. A4. Rank-abundance diagrams for fungal taxa found during the greenhouse bioassay. The top panel shows cumulative counts of mycorrhizal root tips across all contexts, and the following panels show abundance in F. cliffortioides, P. menziesii and grassland contexts, respectively. Bar color indicates whether fungi were exotic (white) or native (gray).
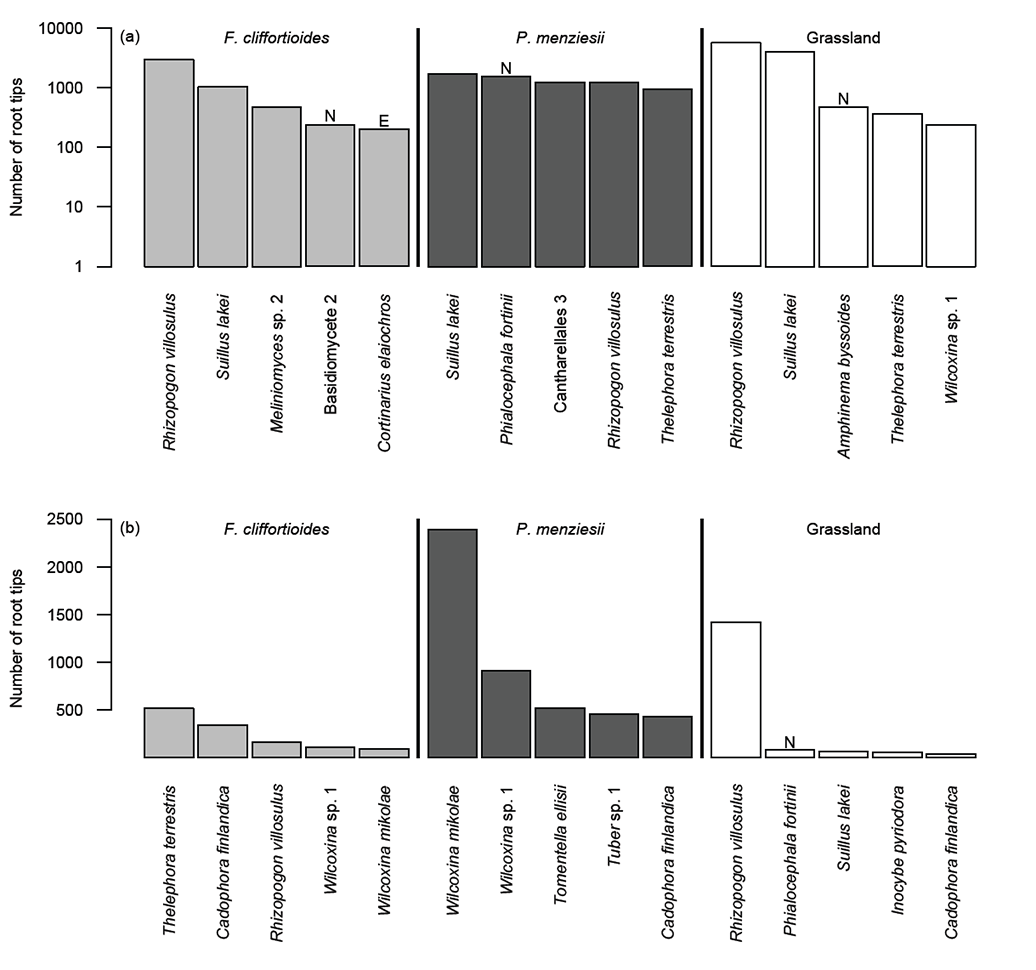
Fig. A5. Rank-abundance diagrams for the five most abundant fungal taxa in each of the three contexts in (a) the field survey and (b) the soil bioassay. The letter “N” denotes native taxa, believed to exist in New Zealand prior to human introductions, and “E” denotes endemic taxa, believed to occur only in New Zealand.