Ecological Archives E096-206-A5
Qiang Yu, Kevin Wilcox, Kimberly La Pierre, Alan K. Knapp, Xingguo Han, and Melinda D. Smith. 2015. Stoichiometric homeostasis predicts plant species dominance, temporal stability, and responses to global change. Ecology 96:23282335. http://dx.doi.org/10.1890/14-1897.1
Appendix E. Supplementary figure illustrating the relationship between measured and predicted foliar nitrogen.
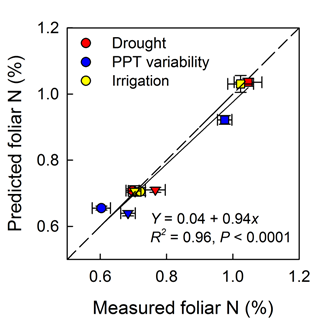
Fig. E1. Relationship between measured and predicted foliar N for three dominant tallgrass prairie plant species. A. gerardii (filled circle), S. canadensis (filled square), and S. nutans (filled triangle). Predicted values of foliar N were calculated using the homeostasis models for each species and soil N measurements. Mean predictions were then compared with mean foliar N concentrations using linear regression and the slope was tested by fitting a standardized major axis through the data. The dashed line indicates a 1:1 relationship between predicted and measured foliar N, and the slopes did not differ significantly (P = 0.35).