Ecological Archives E096-204-D1
Jeffrey A. Wolf, Stephen P. Hubbell, Geoffrey A. Fricker, and Benjamin L. Turner. 2015. Geospatial observations on tropical forest surface soil chemistry. Ecology 96:2313. http://dx.doi.org/10.1890/15-0558.1
Introduction
Understanding biogeochemical cycles in the context of biodiversity is an important research priority (Cornelissen and Cornwell 2014). The causes of soil heterogeneity are expected to shift in importance from abiotic control to biotic control as one transitions from regional spatial scales to plot spatial scales (<1 km²) in lowland tropical forests (Townsend et al. 2008). At the scale of a single hectare, tropical forests contain thousands of individual plants belonging to hundreds of chemically diverse species (Asner et al. 2014) and at different developmental stages varying by orders of magnitude in size (Stephenson et al. 2014). This high chemical and structural diversity is expected to result in strong effects of plant nutrient cycles on soil heterogeneity at plot scales (Townsend et al. 2008).
Most research at plot scales has, however, focused on species-level stem maps in relation to interpolated or krigged maps of soil chemical properties (e.g., Hall et al. 2004, John et al. 2007, Dalling et al. 2012, Baldeck et al. 2013a,b,c, Steidinger in press). A common assumption has been that soil nutrient concentrations at plot scales are controlled entirely by abiotic processes (e.g., John et al. 2007), contrary to theoretical predictions. So far, no high precision geospatially referenced soil chemistry data have been available to test this assumption. Though, recently data at sub-plot scale has provided indications that plants function as sources of fine scale spatial variation in soil properties, possibly through litterfall (Xia et al. 2015). Thinking spatially about soils provides a framework for resolving the current disputes about the drivers of soil heterogeneity in tropical forests at the plot scale.
Chemical and structural diversity of vegetation can now be measured at high spatial resolution using airborne remote sensing platforms (Porder et al. 2005, Asner and Martin 2009). Active remote sensing methods such as light detection and ranging (LiDAR), provide a toolset for studying structural heterogeneity of forests at very high spatial resolution (Lobo and Dalling 2013). Passive remote sensing methods, especially the technique termed “hyperspectral” imaging, or more generally as imaging spectroscopy, when also applied from airborne platforms, can provide unprecedented detail on the canopy chemical heterogeneity occurring both at the scale of individual canopy trees, across landscapes, and even regions (Asner et al. 2014).
Ground surface elevation and digital maps of bedrock provide information on the putative abiotic controls of soil heterogeneity in tropical forests. Digital elevation models from active remote sensing, especially airborne LiDAR, can be used to study both hydrology (Tarboton 1997) and erosional processes (Hurst et al. 2012). Geological maps provide information on bedrock-types, providing information about general physical or chemical differences in soils related to lithology.
Here we describe a georeferenced soil chemistry data set from the Barro Colorado Island 50-ha Forest Dynamics Plot, Republic of Panama (Hubbell and Foster 1983). The data set provides information on rock-derived nutrients, soil pH, total carbon, and total nitrogen. The methods used for studying soil nutrients provide information on cations both at native soil pH and in the acidic multi-element extraction procedure that is frequently used for studying nutrient availability. We present corner coordinates for the plot that were used to georeference the soil cores, facilitating future georeferencing of prediction grids or other geospatial research in the study area that may involve the stem-maps. Additionally, we describe a free open source software tool that can be used to georeference points taken on a plot coordinate system onto a geographic coordinate reference system. Few geospatial studies have published either the coordinates or software used for georeferencing. This is the first georeferenced soil chemistry data for a stem-mapped forest made publically available.
Metadata
Class I. Data set descriptors
A. Data set identity: Geospatial soil chemistry data from the Barro Colorado Island (BCI) 50 ha Forest Dynamics Plot (FDP), Republic of Panama.
B. Data set identification code: GSCD_BCI _2010
C. Data set description
Summary: Data presented include georeferenced soil chemical properties from 625 surface soil cores (6.25 cm diameter x 10 cm depth) sampled in the Barro Colorado Island (BCI) 50 ha Forest Dynamics Plot (FDP), Republic of Panama (9.15° N, 79.8° W) between October 14th and December 2nd of 2010. The sample design is a regular grid with approximately 28 m spacing. The high-precision differential GPS measurements and software used for georeferencing are included in this data set to facilitate geospatial research using high-resolution remote sensing data.
Principal Investigators: Jeffrey A. Wolf, Stephen P. Hubbell, G. Andrew Fricker, and Benjamin L. Turner.
Abstract: At plot scales (<1 km²) used to study tropical forest plant communities the causes of spatial heterogeneity of soils are disputed. We collected, georeferenced, and chemically analyzed a large spatial sample of soil cores (n = 625 sites, 6.25 cm diameter × 10 cm depth cores) on an approximately 28 m regular grid from the Barro Colorado Island (BCI) 50-ha (0.5 km²) forest dynamics plot (FDP), Republic of Panama (9.15° N, 79.8° W). Here we present these data for general use. We also present differential GPS measurements of the plot corners for the BCI 50-ha FDP, which aid in geospatial research in one of the most studied tropical forests. Further, we present a free open source command line software program written in Python that allows point data referenced to the plot coordinate system to be converted to a projected coordinate reference system for geospatial research. Together, the data sets allow for testing the drivers of soil heterogeneity in a tropical tree community using a wide variety of geospatial data sources.
D. Key words: Barro Colorado Island; biodiversity; biogeochemistry; Geographic Information Systems; nutrients; remote sensing; spatial projection; soil.
Class II. Research origin descriptors
A. Overall project description
Identity: A database of georeferenced soil chemical properties for high spatial resolution research on links between biodiversity and biogeochemistry.
Originator:Same as authors.
Period of Study: Sample dates range from October 14, 2010 to December 2, 2010.
Objectives: The purpose of providing a georeferenced soil chemistry data set is to facilitate the use of high spatial resolution remote sensing data, primarily from airborne sensors, such as light detection and ranging or high fidelity imaging spectroscopy, to test hypothesized links between biodiversity and biogeochemistry at plot scales in tropical forests. The soil chemistry data are also part of a broader project to study the rhizosphere of the BCI 50 ha FDP using DNA sequencing of roots and DNA sequencing of microbes.
Abstract: See above.
Sources of funding: See acknowledgements.
B. Specific subproject description
Site description: Data were collected from the BCI 50 ha FDP, Republic of Panama (Hubbell and Foster 1983). The vegetation is old growth lowland tropical forest. Rainfall is seasonal with a dry season from January through April. Average daily temperature is approximately 26° C. Average annual rainfall is approximately 2.6 m, of which approximately 10% falls in the dry season.
Sampling design: Surface soil cores (6.25 cm diameter x 10 cm depth) were collected near the center of every other 20 m by 20 m quadrat across the BCI 50 ha FDP. Even columns were collected from odd rows and odd columns were collected from even rows. All cores were sampled with reference to the plot coordinate system. The sample design resulted in approximately 28 m spacing between cores. Cores were sampled 1 m west of the central 5 m grid system marker within the 20 m by 20 m quadrat. If there was an obstruction, we sampled 1 m away from the central 5 m grid system marker in another compass direction or 1 m away from an adjacent 5 m grid marker.
Research methods:
Soil chemical analysis: The soil core was mixed in the field. A 50 g subsample of mixed fresh soil was removed in a laboratory for air-drying. Roots, rocks, and macroscopic organisms were sorted out of each subsample by hand. The subsamples were air-dried to constant weight at ambient laboratory temperature and humidity. BaCl2 exchangeable cations (Al, Ca, Fe, K, Mg, Mn, and Na) were determined by extraction in 0.1 M BaCl2 (2 h, 1:30 soil to solution ratio) with detection by inductively-coupled plasma optical-emission spectrometry (ICP-OES) on an Optima 7300 DV (Perkin-Elmer Ltd, Shelton, CT, USA) (Hendershot et al., 2008). Total exchangeable bases (TEB) from the BaCl2 extraction were calculated as the sum of Ca, K, Mg, and Na; effective cation exchange capacity (ECEC) was calculated as the sum of Al, Ca, Fe, K, Mg, Mn, and Na; base saturation was calculated as (TEB ÷ ECEC) × 100. Mehlich-3 extractable cations (Al, Ca, Cu, Fe, K, Mg, Mn, Zn) and P were determined by extraction in Mehlich-3 solution (Mehlich 1984) with detection by ICP-OES. Soil pH was determined in both deionized water and 10 mM CaCl2 in a 1:2 soil to solution ratio using a glass electrode (Hach Ltd.). Air-dried soils were ground in a ball mill prior to determining total carbon and nitrogen by automated combustion and gas chromatography with thermal conductivity detection using a Thermo Flash 1112 analyzer (CE Elantech, Lakewood, NJ, USA). Soils were analyzed in the Smithsonian Tropical Research Institute soil lab. Soil chemistry data for all georeferenced soil observations are summarized in table 1.
Quality control: We used internal laboratory standards designed to evaluate broad consistency amongst batches of the sample analyses as a means to estimate error associated with measurements of soil chemical properties. The internal laboratory standard soils were taken in large batches from nearby lowland tropical forests with contrasting soil properties (pH, exchangeable cations, P), air-dried, sieved (< 2 mm), and thoroughly mixed. Variation in measured values on the same standards includes both error inherent in the method and variation in the sample itself. The coefficient of variation (CV) was used to identify soil properties that may have low measurement precision. The CV on the standard sets a maximum on the measurement error associated with each soil property. The repeated analysis of the standards identified several soil chemical properties with high CV using the methods described in Class II.B. under Soil chemical analysis. In addition, several field sampled soil properties included measurements below analytical detection limits. There was one observation on BaCl2 K and Mn that was below the detection limit (0.5 mg/kg), so we used the detection limit as the value. For elements with multiple measurements below the detection limit we recorded the values below the limit of detection as zeros. The subset of data we suggest using are soil properties with low CV on standard soils and without > 1 detection limit issue. A summary of the quality control analysis is presented in table 2.
Geographic locations: We took prolonged static measurements of the plot corners using a dual-frequency Trimble T1/T2 microcentered antenna and Trimble 4700 receiver (Trimble Navigation Ltd., Sunnyvale, CA, USA) differential GPS system at the end of the dry season (April 2014). The measurements were processed to improve spatial accuracy by a third-party (Sean Bowers, Geodigital International Corporation, Lompoc, CA, USA) using Novatel Grafnet software and Continuously Operating Reference Stations (CORS) located around the Panama Canal Zone.
Georeferencing: We parameterized an affine function for spatial transformation using the differential GPS measurements of the plot corners. We transformed the spatial observations referenced to the plot coordinate system into spatial observations referenced to a geographical coordinate system (WGS 1984 UTM Zone 17N, EPSG: 32617). Parameterizing the affine function consists of fitting two linear equations of the form:
![]()
where Y is a column vector of length N representing the north or east axis of a GPS measured location in the geographical (projected) coordinate system, X is an N × 3 matrix of the unprojected x and y coordinates from the plot and a column of 1’s for the intercept term, ![]() is a column vector of length 3 representing coefficients, and
is a column vector of length 3 representing coefficients, and ![]() is an error term. The error term is assumed to have a zero mean. The ordinary least squares (OLS) solution for
is an error term. The error term is assumed to have a zero mean. The ordinary least squares (OLS) solution for ![]() is
is ![]() By solving the matrix equations once using the north coordinates for the Y matrix and again using the east coordinates for the Y matrix, the result is two sets of
By solving the matrix equations once using the north coordinates for the Y matrix and again using the east coordinates for the Y matrix, the result is two sets of ![]() vectors. The two different
vectors. The two different ![]() vectors can then be used to project an arbitrary number of points referenced to a plot coordinate system into a geographic coordinate system.
vectors can then be used to project an arbitrary number of points referenced to a plot coordinate system into a geographic coordinate system.
Software to perform the affine transformation is included as a data file and a development version is available online (https://github.com/jeffreywolf/afproj). We implemented the software in Python using Numpy (www.numpy.org). This software produces identical results to the Affine Function in the Spatial Transformation Tool of ArcGIS 10.1 (ESRI, Environmental Systems Research Institute, Redlands, CA). However, this software is free, quick, and scalable to large datasets. There is also an option to simulate multiple realizations of the locations of the projected points by random draws from a two-dimensional Gaussian distribution with mean equal to the point estimate along the north and east axis and standard deviation along each dimension equal to the standard error in the north or east direction. Instructions on how to use the software are provided in the README file distributed with the software.
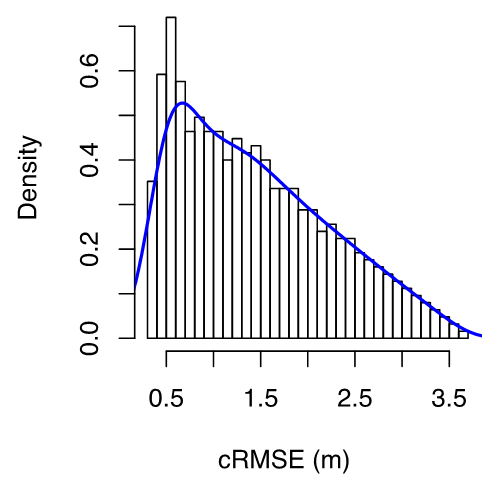
Locational quality assessment: We used afproj to simulate the locations of each soil core 1000 times. We estimated the locational precision of each georeferenced core in two-dimensional space from the simulated data. The distribution of circular root mean square error (cRMSE) across all soil cores is shown in figure 2. The cRMSE shows that the average error for sites ranges from 0.32 m to 3.62 m. The 95% CI for the location of each core in two-dimensional space ranges from 0.65 m to 7.23 m.
Class III. Data set status and accessibility
A. Status
Metadata status: Metadata are complete as of April 30, 2015
Data verification: Data verification was performed by Jeffrey A. Wolf, see Class II, Section B, ‘Quality control’, for details.
B. Accessibility
Storage location and medium: The Ecological Society of America’s Ecological Archives.
Contact person: Jeffrey A. Wolf, Department of Ecology and Evolutionary Biology, University of California, Los Angeles. ([email protected])
Copyright restrictions: There are no data copyright restrictions. The software has an MIT license.
Costs: None.
Class IV. Data structural descriptors
A. Data Set File
See Table 3.
B. Variable information
See Tables 4, 5, and 6.
Table 1. Georeferenced soil observations summary.
Soil Property |
Mean (SD) |
Minimum |
Maximum |
CV |
Mehlich-3 (625 cores) |
|
|
|
|
Al (mg kg-1) |
801 (235) |
160 |
1430 |
29.4 % |
Ca (mg kg-1) |
1560 (944) |
101 |
6510 |
60.6 % |
Cu (mg kg-1) |
5.35 (1.76) |
1.49 |
15.2 |
32.9 % |
Fe (mg kg-1) |
119 (47.5) |
32.9 |
481 |
40.0 % |
K (mg kg-1) |
101 (56.9) |
28.0 |
397 |
56.4 % |
Mg (mg kg-1) |
255 (145) |
27.4 |
1800 |
56.9 % |
Mn (mg kg-1) |
259 (123) |
4.60 |
670 |
47.7 % |
P (mg kg-1) |
3.16 (2.34) |
0.96 |
34.9 |
73.9 % |
Zn (mg kg-1) |
2.68 (2.34) |
0.16 |
29.8 |
87.3 % |
BaCl2 (625 cores) |
|
|
|
|
Al (mg kg-1) |
16.7 (34.1) |
- |
316 |
210 % |
Ca (mg kg-1) |
2250 (1510) |
112 |
13600 |
67.2 % |
Fe (mg kg-1) |
1.68 (7.86) |
- |
159 |
468 % |
K (mg kg-1) |
110 (71.0) |
0.5 |
487 |
64.6 % |
Mg (mg kg-1) |
304 (179) |
35.4 |
2370 |
59.0 % |
Mn (mg kg-1) |
76.5 (62.2) |
0.5 |
358 |
81.3 % |
Na (mg kg-1) |
11.3 (45.8) |
- |
1010 |
407 % |
BS (%) |
94.2 (9.37) |
23.2 |
100 |
9.94 % |
eCEC (cmol(+)/kg-1) |
14.5 (8.41) |
3.20 |
81.4 |
57.9 % |
TEB (cmol(+) kg-1) |
14.1 (8.69) |
1.00 |
81.4 |
61.8 % |
Element Analyzer (624 cores) |
|
|
|
|
C (%) |
4.71 (1.56) |
1.84 |
18.2 |
33.1 % |
N (%) |
0.446 (0.112) |
0.140 |
1.35 |
25.1 % |
C:N ratio (unitless) |
10.5 (1.06) |
7.60 |
17.1 |
10.2 % |
Glass Electrode (625 cores) |
|
|
|
|
pH (pH units) |
5.79 (0.499) |
4.56 |
7.62 |
8.61 % |
pH CaCl2 (pH units) |
5.23 (0.532) |
4.00 |
7.17 |
10.2 % |
TEB, total exchangeable bases; eCEC, effective cation exchange capacity; BS, base saturation. Minimum left blank if below limit of detection for >1 site. All values reported to three significant figures except CV shown to one decimal.
Table 2. Standard soil summary.
Soil Property |
Standard |
N |
Mean (SD) |
CV |
Mehlich-3 |
|
|
|
|
Al (mg kg-1) |
Albrook |
16 |
975 (127) |
13.0 % |
Ca (mg kg-1) |
Albrook |
16 |
3090 (274) |
8.8 % |
Cu (mg kg-1) |
Albrook |
16 |
1.09 (0.139) |
12.8 % |
Fe (mg kg-1) |
Albrook |
16 |
176 (34.9) |
19.8 % |
K (mg kg-1) |
Albrook |
16 |
221 (24.6) |
11.1 % |
Mg (mg kg-1) |
Albrook |
16 |
771 (71.3) |
9.2 % |
Mn (mg kg-1) |
Albrook |
16 |
286. (29.4) |
10.3 % |
P (mg kg-1) |
Albrook |
16 |
21.8 (2.15) |
9.9 % |
Zn (mg kg-1) |
Albrook |
16 |
4.11 (0.508) |
12.3 % |
BaCl2 |
|
|
|
|
Al (mg kg-1) |
Albrook |
43 |
42.6 (4.69) |
11.0 % |
Ca (mg kg-1) |
Albrook |
43 |
3260 (138) |
4.2 % |
Fe (mg kg-1) |
Albrook |
43 |
2.87 (5.48) |
190.0 % |
K (mg kg-1) |
Albrook |
43 |
271 (17.8) |
6.6 % |
Mg (mg kg-1) |
Albrook |
43 |
813 (31.4) |
3.9 % |
Mn (mg kg-1) |
Albrook |
43 |
333 (14.2) |
4.3 % |
Na (mg kg-1) |
Albrook |
43 |
21.9 (12.0) |
54.9 % |
BS (%) |
Albrook |
43 |
93.4 (0.28) |
0.3 % |
eCEC (cmol(+)/kg-1) |
Albrook |
43 |
25.4 (1.01) |
4.0 % |
TEB (cmol(+) kg-1) |
Albrook |
43 |
23.7 (0.942) |
3.9 % |
Element Analyzer |
|
|
|
|
C (%) |
Madden |
12 |
3.95 (0.0755) |
1.9 % |
C (%) |
Mpala |
12 |
2.07 (0.0532) |
2.5 % |
N (%) |
Madden |
12 |
0.338 (0.0116) |
3.1 % |
N (%) |
Mpala |
12 |
0.166 (0.0132) |
8.0 % |
C:N ratio (unitless) |
Madden |
12 |
11.7 (0.259) |
2.2 % |
C:N ratio (unitless) |
Mpala |
12 |
12.6 (0.865) |
6.8 % |
Glass Electrode |
|
|
|
|
pH (pH units) |
Madden |
23 |
7.3 (0.0540) |
0.7 % |
pH (pH units) |
Albrook |
23 |
4.93 (0.0414) |
0.8 % |
pH CaCl2 (pH units) |
Madden |
23 |
6.89 (0.0507) |
0.7 % |
pH CaCl2 (pH units) |
Albrook |
23 |
4.49 (0.0499) |
1.1 % |
TEB, total exchangeable bases; eCEC, effective cation exchange capacity; BS, base saturation. Minimum left blank if below limit of detection for > 1 site. All values reported to three significant figures except CV shown to one decimal.
Table 3. List of contents of each data file and associated details.
Identity & MD5 Checksum |
File description & records |
Size |
Format and Storage |
Variable table |
soils.csv
d4deb84fa3a2300097efc07a7a42700c |
Comma-separate value file containing geospatial soil chemistry data
625 records
|
100 kb |
ASCII text, comma separated value (csv) file |
Table B.1 |
standards.csv
bdeb50c58864228f02b06be2971d11dc |
Comma-separated value file containing measurements on soil standards run during analysis of field sampled soils.
738 records
|
17 kb |
ASCII text, comma separated value (csv) file |
Table B.2 |
corners.csv
00b9af230a2cd73315d473083f6e7647 |
Comma-separated value file containing measurements of plot corner locations
4 records
|
537 b |
ASCII text, comma separated value (csv) file |
Table B.3 |
afproj-master.zip
30f8248abbe2851dd2b5763933ca6165
|
Python source code for affine spatial transformation.
-
|
9.0 kb |
Zip file containing Python source code |
- |
The file size is the reported to the exact number of decimal places given using the command “ls -lah” at the Terminal on a Mac computer running OS X (version 10.10.3).
Table 4. Geospatial soil chemistry data.
The following table summarizes the header variables associated with the file “soils.csv”.
Variable |
Definition |
Units |
Storage type |
Values or ange |
Missing data code |
uid |
Primary key |
- |
Integer |
1 |
none |
qid |
Quadrat identifier |
- |
Character |
Q0001 |
none |
gx |
x-coordinate on plot coordinate system |
Meters |
Numeric |
9.0 |
none |
gy |
y-coordinate on plot coordinate system |
Meters |
Numeric |
10.0 |
none |
utm_e |
Easting in the WGS 1984 UTM Zone 17 N (EPSG:32617) projection |
Meters |
Numeric |
625781.4595 |
none |
utm_n |
Northing in the WGS 1984 UTM Zone 17 N (EPSG:32617) |
Meters |
Numeric |
1011751.096 |
none |
M3Al |
Aluminum measured by Mehlich-3 extraction |
mg/kg |
Numeric |
160.3 |
none |
M3Ca |
Calcium measured by Mehlich-3 extraction |
mg/kg |
Numeric |
101.1 |
none |
M3Cu |
Copper measured by Mehlich-3 extraction |
mg/kg |
Numeric |
1.490 |
none |
M3Fe |
Iron measured by Mehlich-3 extraction |
mg/kg |
Numeric |
32.9 |
none |
M3K |
Potassium measured by Mehlich-3 extraction |
mg/kg |
Numeric |
28.0 |
none |
M3Mg |
Magnesium measured by Mehlich-3 extraction |
mg/kg |
Numeric |
27.4 |
none |
M3Mn |
Manganese measured by Mehlich-3 extraction |
mg/kg |
Numeric |
4.6 |
none |
M3P |
Phosphorous measured by Mehlich-3 extraction |
mg/kg |
Numeric |
0.960 |
none |
M3Zn |
Zinc measured by Mehlich-3 extraction |
mg/kg |
Numeric |
0.160 |
none |
Al |
Aluminum measured by BaCl2 extraction |
mg/kg |
Numeric |
0.00 |
none |
Ca |
Calcium measured by BaCl2 extraction |
mg/kg |
Numeric |
112.2 |
none |
Fe |
Iron measured by BaCl2 extraction |
mg/kg |
Numeric |
0.000 |
none |
K |
Potassium measured by BaCl2 extraction |
mg/kg |
Numeric |
0.5 |
none |
Mg |
Magnesium measured by BaCl2 extraction |
mg/kg |
Numeric |
35.4 |
none |
Mn |
Manganese measured by BaCl2 extraction |
mg/kg |
Numeric |
0.50 |
none |
Na |
Sodium measured by BaCl2 extraction |
mg/kg |
Numeric |
0.00 |
none |
BS |
Base saturation measured by BaCl2 extraction |
% |
Numeric |
23.20 |
none |
ECEC |
Effective cation exchange capacity measured by BaCl2 extraction |
cmol(+)/kg |
Numeric |
3.20 |
none |
TEB |
Total Exchangeable Bases measured by BaCl2 extraction |
cmol(+)/kg |
Numeric |
1.00 |
none |
C |
Total carbon |
% |
Numeric |
1.836 |
NA |
N |
Total nitrogen |
% |
Numeric |
0.1400 |
NA |
CN_ratio |
Ratio of total carbon to total nitrogen |
Unit-less |
Numeric |
7.60 |
NA |
pH_water |
pH in deionized water |
pH units |
Numeric |
4.560 |
none |
pH_salt |
pH in 0.1 M CaCl2 |
pH units |
Numeric |
4.000 |
none |
Table 5. The following table summarizes header variables associated with the file “standards.csv”, containing measurements of soil chemical properties on standard soils measured multiple times during the field sample chemical analyses.
Variable |
Definition |
Units |
Storage type |
Values or range |
Missing data code |
Method |
Chemical analysis |
- |
Character |
bacl2,cn,mehlich3,pH |
none |
Standard |
Standard soil |
- |
Character |
Albrook, Madden, Mpala |
none |
Property |
Soil chemical property |
- |
Character |
All measured soil chemical properties |
none |
Value |
Value of the soil property |
See units in Table B.1 |
Numeric |
0.00 to 3777.83 |
none |
Table 6. The following table summarizes header variables associated with the file “corners.csv”, containing post processed coordinates for the BCI 50 ha plot corners.
Variable |
Definition |
Units |
Storage type |
Values or range |
Missing data code |
gid |
Primary key |
- |
Integer |
1 |
none |
dms_lat |
Latitude in WGS 1984 |
domain, minutes, seconds |
Numeric |
9 09 03.36346 to |
none |
dms_long |
Longitude in WGS 1984 |
domain, minutes, seconds |
Numeric |
-79 51 19.16941 |
none |
ellhgt |
Elevation relative to reference geoid |
meters |
Numeric |
132.9571 |
none |
dd_lat |
Latitude in WGS 1984 |
decimal degrees |
Numeric |
9.150934294 |
none |
dd_long |
Longitude in WGS 1984 |
decimal degrees |
Numeric |
-79.85532484 |
none |
se |
Standard error easting |
meters |
Numeric |
0.0916 |
none |
sn |
Standard error northing |
meters |
Numeric |
0.0267 |
none |
sup |
Standard error in elevation |
meters |
Numeric |
0.1607 |
none |
utm_e |
Easting |
meters |
Numeric |
625771.1147 |
none |
utm_n |
Northing |
meters |
Numeric |
1012238.77 |
none |
gx |
x-coordinate on plot coordinate system |
meters |
Numeric |
0 |
none |
gy |
y-coordinate on plot coordinate system |
meters |
Numeric |
0 |
none |
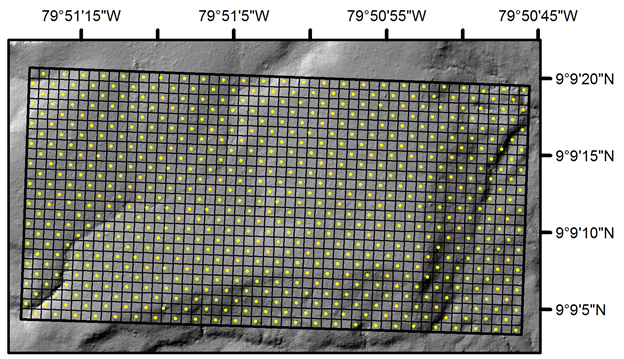
Fig. 1. Geographic locations of soil cores in the Barro Colorado Island 50 ha Forest Dynamics Plot, Republic of Panama (9.15° N, 79.8° W). The plot is oriented at 3° declination from true north. The plot dimensions are 1.0 km by 0.5 km. The background image is a 1 m resolution hillshade model from airborne LiDAR (Lobo and Dalling 2013).
Fig. 2. Georeferencing precision. The figure shows circular root mean square error (cRMSE) in units of meters. The bars are discretized frequencies and the blue curve illustrates a Gaussian kernel density estimate.
Acknowledgments
We would like to thank Daniela Cusack, Phil Rundel, and two anonymous reviewers for comments on the manuscript. Soil chemistry data were collected with funding from a Smithsonian Institution Scholarly Studies Grant, Sigma Xi GiAR, University of California Los Angeles, and the US National Science Foundation. Research on the BCI 50-ha FDP has been made possible by US National Science Foundation grants to S.P. Hubbell: DEB-0640386, DEB-0425651, DEB-0346488, DEB-0129874, DEB-00753102, DEB-9909347, DEB-9615226, DEB-9615226, DEB-9405933, DEB-9221033, DEB-9100058, DEB-8906869, DEB-8605042, DEB-8206992, DEB-7922197, support from the Center for Tropical Forest Science, the Smithsonian Tropical Research Institute, the John D. and Catherine T. MacArthur Foundation, the Mellon Foundation, the Small World Institute Fund, and numerous private individuals, and through the hard work of over 100 people from 10 countries over the past two decades. The plot project is part of the Center for Tropical Forest Science, a global network of large-scale demographic tree plots. A US National Science Foundation Doctoral Dissertation Improvement Grant to A. Fricker (BCS-1333701) supported measurement of the plot corner locations. Laboratory support was provided by Dayana Agudo and Aleksandra Bielnicka.
Literature cited
Asner, G. P., and R. E. Martin. 2009. Airborne spectranomics: mapping canopy chemical and taxonomic diversity in tropical forests. Frontiers in Ecology and the Environment 7:269–276.
Asner, G. P., R. E. Martin, R. Tupayachi, C. B. Anderson, F. Sinca, L. Carranza-Jiménez, and P. Martinez. 2014. Amazonian function diversity from forest canopy chemical assembly. Proceedings of the National Academy of Sciences (USA) 111:5604–5609.
Baldeck, C. A., K. E. Harms, J. B. Yavitt, R. John, B. L. Turner, R. Valencia, H. Navarrete, S. J. Davies, G. B. Chuyong, D. Kenfack, D. W. Thomas, S. Madawala, N. Gunatilleke, S. Gunatilleke, S. Bunyavejchewin, S. Kiratiprayoon, A. Yaacob, M. N. N. Supardi, and J.W. Dalling. 2013 Soil resources and topography shape local tree community structure in tropical forests. Proceedings of the Royal Society B280: 20122532.
Baldeck, C. A., K. E. Harms, J. B. Yavitt, R. John, B. L. Turner, R. Valencia, H. Navarrete, S. Bunyavejchewin, S. Kiratiprayoon, A. Yaacob, M. N. N. Supardi, S. J. Davies, S. P. Hubbell, G. B. Chuyong, D. Kenfack, D. W. Thomas, and J. W. Dalling. 2013. Habitat filtering across tree life stages in tropical forest communities. Proceedings of the Royal Society B280:20140548.
Baldeck, C. A., S. W. Kembel, K. E. Harms, J. B. Yavitt, R. John, B. L. Turner, G. B. Chuyong, D. Kenfack, D. W. Thomas, S. Madawala, N. Guntalleke, S. Gunatilleke, S. Bunyavejchewin, S. Kiratiprayoon, A. Yaacob, M. N. N. Supardi, R. Valencia, H. Navarrete, S. J. Davies, S. P. Hubbell, and J. W. Dalling. 2013. A taxonomic comparison of local habitat niches of tropical trees. Oecologia 173:1491–1498.
Cornelissen, J. H. C., and W. K. Cornwell. 2014. The tree of life in ecosystems: evolution of plant effects on carbon and nutrient cycling. Journal of Ecology102:269–274.
Dalling, J. W., S. A. Schnitzer, C. Baldeck, K. E. Harms, R. John, S. A. Mangan, E. Lobo, J. B. Yavitt, and S. P. Hubbell. 2012. Resource-based habitat associations in a neotropical liana community.Journal of Ecology100:1174–1182.
Hall, J. S., J. J. McKenna, P. M. S. Ashton, and T. G. Gregoire. 2014. Habitat characterizations underestimate the role of edaphic factors controlling the distribution of Entandrophragma. Ecology 85:2171–2183.
Hendershot, W. H., H. Lalande, and M. Duquette. 2008. Ion exchange and exchangeable cations. Soil Sampling and Methods of Analysis. Eds. M. R. Carter and E. Gregorich. Canadian Society of Soil Science and CRC Press: Boca Raton, pp 173–178.
Hubbell, S. P., and R. Foster. 1983. Diversity of canopy trees in a neotropical forest and implications for conservation, in Tropical Rain Forest: Ecology and Management, edited by S. Sutton, T. Whitmore, and A. Chadwick, pp. 25–41, Blackwell Scientific Publications, Oxford.
Hurst, M. D., S. M. Mudd, R. Walcott, M. Attal, and K. Yoo. 2012. Using hilltop curvature to derive the spatial distribution of erosion rates. Journal of Geophysical Research 117:F0217.
John, R., J. W. Dalling, K. E. Harms, J. B. Yavitt, R. F. Stallard, M. Mirabello, S. P. Hubbell, R. Valencia, H. Navarrete, M. Vallejo, and R. B. Foster. 2007. Soil nutrients influence spatial distributions of tropical tree species. Proceedings of the National Academy of Sciences (USA) 104:864–869.
Lobo, E., and J. W. Dalling. 2013. Effects of topography, soil type and forest age on the frequency and size distribution of canopy gap disturbances in a tropical forest. Biogeosciences 10:6769–6781.
Mehlich, A. 1984. Mehlich 3 soil test extractant: a modification of Mehlich-2 extractant. Communications in Soil Science and Plant Analysis 15:1409–1416.
Porder, S., G. P. Asner, and P. M. Vitousek. 2005. Ground-based and remotely sensed nutrient availability across a tropical landscape . Proceedings of the National Academy of Sciences (USA) 102:10909–10912.
Stephenson, N. L., A. J. Das, R. Condit, S. E. Russo, P. J. Baker, N. G. Beckman, D. A. Coomes, E. R. Lines, W. K. Morris, N. Rüger, E. Álvarez, C. Blundo, S. Bunyavejchewin, G. Chuyong, S. J. Davies, Á. Duque, C. N. Ewango, O. Flores, J. F. Franklin, H. R. Grau, Z. Hao, M. E. Harmon, S. P. Hubbell, D. Kenfack, Y. Lin, J.-R. Makana, A. Malizia, L. R. Malizia, R. J. Pabst, N. Pongpattananurak, S.-H. Su, I-F. Sun, S. Tan, D. Thomas, P. J. van Mantgem, X. Wang, S. K. Wiser, and M.A. Zavala. 2014. Rate of tree carbon accumulation increases continuously with tree size. Nature 507:90–93.
Steidinger, B. In press. Qualitative differences in tree species distributions along soil chemical gradients give clues to the mechanisms of specialization: why boron may be the most important soil nutrient at Barro Colorado Island. New Phytologist DOI: 10.1111/nph.13298
Tarboton, D. G. 1997. A new method for the determination of flow directions and upslope areas in grid digital elevation models. Water Resources Research 33(2):309–319.
Townsend, A. R., G. P. Asner, and C. C. Cleveland. 2008. The biogeochemical heterogeneity of tropical forests. Trends in Ecology and Evolution 23:424–431.
Xia, S-W., J. Chen, D. Schaefer, and M. Detto. In press. Scale-dependent soil macronutrient heterogeneity reveals effects of litterfall in a tropical rainforest. Plant and Soil,DOI: 10.1007/s11104-015-2402-z