Ecological Archives E096-200-A1
Sara E. Kuebbing, Aimée T. Classen, Jaime J. Call, Jeremiah A. Henning, and Daniel Simberloff. 2015. Plantsoil interactions promote co-occurrence of three nonnative woody shrubs. Ecology 96:22892299. http://dx.doi.org/10.1890/14-2006.1
Appendix A. Tables showing ANOVA with a priori linear contrasts, spatial autocorrelation for dependent and independent variables in a field plantsoil feedback experiment, standardized regression coefficients and AIC scores from reduced mixed effect models and simultaneous autoregressive error models, and mean and standard error of plant growth metrics from a greenhouse plantsoil feedback experiment; and figures showing the experimental design of greenhouse plantsoil feedback experiment, feedback calculations for three nonnative shrubs in home and sterile soils, and plots of the first two principal component axes used to describe variation among field plots in a field plantsoil feedback experiment.
Table A1. Full ANOVA table with a priori linear contrasts for models testing effects of four soil treatments (Lonicera maackii-conditioned soils, Ligustrum sinense-conditioned soils, uninvaded control soils, and sterilized soils) on performance of the woody shrubs Ligustrum sinense (1a), Lonicera maackii (b), Rhamnus davurica (c), and Lindera benzoin (d) in a greenhouse plant-soil feedback experiment. If the dependent variable was transformed, the specific transformation used is noted in brackets [transformations].
a. Ligustrum sinense (Chinese privet)
shoot biomass (g) [log + 0.1] |
|||||
|
df |
SS |
MS |
F value |
P |
Soil |
3 |
10.33 |
3.44 |
24.47 |
< 0.0001 |
Sterile vs. live |
1 |
|
10.26 |
72.88 |
< 0.0001 |
L. sinense vs. L. maackii |
1 |
|
0.01 |
0.10 |
0.76 |
Invaded vs. Uninvaded |
1 |
|
0.06 |
0.42 |
0.52 |
Residuals |
47 |
6.62 |
0.14 |
|
|
root biomass (g) [log + 0.1] |
|||||
|
df |
SS |
MS |
F value |
P |
Soil |
3 |
13.03 |
4.32 |
30.27 |
< 0.0001 |
Sterile vs. live |
1 |
12.87 |
12.87 |
89.72 |
< 0.0001 |
L. sinense vs. L. maackii |
1 |
0.16 |
0.16 |
1.08 |
0.30 |
Invaded vs. Uninvaded |
1 |
0.001 |
0.001 |
0.005 |
0.95 |
Residuals |
47 |
6.74 |
0.14 |
|
|
height (cm) [log + 0.1] |
|||||
|
df |
SS |
MS |
F value |
P |
Soil |
3 |
8.28 |
2.76 |
16.71 |
< 0.0001 |
Sterile vs. live |
1 |
8.24 |
8.24 |
49.91 |
< 0.0001 |
L. sinense vs. L. maackii |
1 |
0.03 |
0.03 |
0.19 |
0.67 |
Invaded vs. Uninvaded |
1 |
0.002 |
0.002 |
0.015 |
0.90 |
Residuals |
47 |
7.76 |
0.17 |
|
|
Number of leaves [square root] |
|||||
|
df |
SS |
MS |
F value |
P |
Soil |
3 |
110.7 |
36.9 |
20.37 |
< 0.0001 |
Sterile vs. live |
1 |
108.84 |
108.84 |
60.07 |
< 0.0001 |
L. sinense vs. L. maackii |
1 |
1.85 |
1.85 |
1.02 |
0.32 |
Invaded vs. Uninvaded |
1 |
0.00 |
0.00 |
0.00 |
0.98 |
Residuals |
47 |
85.16 |
1.81 |
|
|
b. Lonicera maackii (bush honeysuckle)
shoot biomass (g) [log + 1] |
|||||
|
df |
SS |
MS |
F value |
P |
Soil |
3 |
0.45 |
0.15 |
11.80 |
< 0.0001 |
Sterile vs. live |
1 |
0.39 |
0.39 |
30.55 |
< 0.0001 |
L. sinense vs. L. maackii |
1 |
0.02 |
0.02 |
1.80 |
0.19 |
Invaded vs. Uninvaded |
1 |
0.04 |
0.04 |
3.03 |
0.09 |
Residuals |
47 |
0.59 |
0.01 |
|
|
root biomass (g) [log+1] |
|||||
|
df |
SS |
MS |
F value |
P |
Soil |
3 |
0.78 |
0.26 |
13.49 |
< 0.0001 |
Sterile vs. live |
1 |
0.68 |
0.68 |
35.13 |
< 0.0001 |
L. sinense vs. L. maackii |
1 |
0.06 |
0.06 |
3.06 |
0.09 |
Invaded vs. Uninvaded |
1 |
0.04 |
0.04 |
2.27 |
0.14 |
Residuals |
47 |
0.91 |
0.02 |
|
|
height (cm) [log + 1] |
|||||
|
df |
SS |
MS |
F value |
P |
Soil |
3 |
9.23 |
3.08 |
14.44 |
< 0.0001 |
Sterile vs. live |
1 |
8.41 |
8.41 |
39.44 |
< 0.0001 |
L. sinense vs. L. maackii |
1 |
0.40 |
0.40 |
1.85 |
0.18 |
Invaded vs. Uninvaded |
1 |
0.43 |
0.43 |
2.03 |
0.16 |
Residuals |
47 |
10.02 |
0.21 |
|
|
Number of leaves [square root] |
|||||
|
df |
SS |
MS |
F value |
P |
Soil |
3 |
58.60 |
19.53 |
36.32 |
< 0.0001 |
Sterile vs. live |
1 |
56.25 |
56.25 |
104.58 |
< 0.0001 |
L. sinense vs. L. maackii |
1 |
0.35 |
0.35 |
0.65 |
0.43 |
Invaded vs. Uninvaded |
1 |
2 |
2 |
3.72 |
0.06 |
Residuals |
47 |
25.28 |
0.54 |
|
|
c. Rhamnus davurica (Dahurian buckthorn)
shoot biomass (g) [log + 0.1] |
|||||
|
df |
SS |
MS |
F value |
P |
Soil |
3 |
4.68 |
1.56 |
10.26 |
< 0.0001 |
Sterile vs. live |
1 |
3.63 |
3.63 |
23.87 |
< 0.0001 |
L. sinense vs. L. maackii |
1 |
0.20 |
0.20 |
1.31 |
0.26 |
Invaded vs. Uninvaded |
1 |
0.85 |
0.85 |
5.60 |
0.02 |
Residuals |
47 |
6.69 |
0.15 |
|
|
root biomass (g) [log + 0.1] |
|||||
|
df |
SS |
MS |
F value |
P |
Soil |
3 |
5.53 |
1.84 |
12.86 |
< 0.0001 |
Sterile vs. live |
1 |
4.79 |
4.79 |
33.42 |
< 0.0001 |
L. sinense vs. L. maackii |
1 |
0.47 |
0.47 |
3.28 |
0.08 |
Invaded vs. Uninvaded |
1 |
0.27 |
0.27 |
1.87 |
0.18 |
Residuals |
47 |
6.31 |
0.14 |
|
|
height (cm) [log + 0.1] |
|||||
|
df |
SS |
MS |
F value |
P |
Soil |
3 |
1.74 |
0.58 |
7.57 |
0.003 |
Sterile vs. control |
1 |
0.85 |
0.85 |
11.04 |
0.002 |
Sterile vs. L. sinense |
1 |
0.03 |
0.03 |
0.40 |
0.53 |
Sterile vs. L. maackii |
1 |
0.87 |
0.87 |
11.27 |
0.002 |
Residuals |
44 |
3.38 |
0.08 |
|
|
Number of leaves |
|||||
|
df |
SS |
MS |
F value |
P |
Soil |
3 |
333.2 |
111.05 |
16.35 |
< 0.0001 |
Sterile vs. live |
1 |
301.95 |
301.95 |
44.46 |
< 0.0001 |
L. sinense vs. L. maackii |
1 |
13.85 |
13.85 |
2.04 |
0.16 |
Invaded vs. Uninvaded |
1 |
17.36 |
17.36 |
2.56 |
0.12 |
Residuals |
44 |
298.8 |
6.79 |
|
|
d. Lindera benzoin (spicebush)
shoot biomass (g) [log + 0.1] |
|||||
|
df |
SS |
MS |
F value |
P |
Soil |
3 |
1.37 |
0.46 |
4.34 |
0.009 |
Sterile vs. live |
1 |
1.15 |
1.15 |
10.91 |
0.002 |
L. sinense vs. L. maackii |
1 |
0.12 |
0.12 |
1.14 |
0.29 |
Invaded vs. Uninvaded |
1 |
0.10 |
0.10 |
0.99 |
0.33 |
Residuals |
46 |
4.85 |
0.11 |
|
|
root biomass (g) [log + 0.1] |
|||||
|
df |
SS |
MS |
F value |
P |
Soil |
3 |
1.16 |
0.39 |
2.92 |
0.04 |
Sterile vs. live |
1 |
1.15 |
1.15 |
8.70 |
0.005 |
L. sinense vs. L. maackii |
1 |
0.01 |
0.01 |
0.04 |
0.84 |
Invaded vs. Uninvaded |
1 |
0.003 |
0.003 |
0.02 |
0.89 |
Residuals |
46 |
6.10 |
0.13 |
|
|
height (cm) [log + 0.1] |
|||||
|
df |
SS |
MS |
F value |
P |
Soil |
3 |
0.30 |
0.10 |
1.19 |
0.32 |
Sterile vs. live |
1 |
0.26 |
0.26 |
3.00 |
0.09 |
L. sinense vs. L. maackii |
1 |
0.001 |
0.001 |
0.01 |
0.92 |
Invaded vs. Uninvaded |
1 |
0.05 |
0.05 |
0.56 |
0.46 |
Residuals |
46 |
3.91 |
0.09 |
|
|
Number of leaves |
|||||
|
df |
SS |
MS |
F value |
P |
Soil |
3 |
99.16 |
33.05 |
9.03 |
< 0.0001 |
Sterile vs. live |
1 |
95.10 |
95.10 |
25.98 |
< 0.0001 |
L. sinense vs. L. maackii |
1 |
3.77 |
3.77 |
1.03 |
0.32 |
Invaded vs. Uninvaded |
1 |
0.29 |
0.29 |
0.08 |
0.78 |
Residuals |
46 |
168.36 |
3.66 |
|
|
Table A2. A field plant–soil feedback experiment revealed signs of spatial autocorrelation (i.e., significant Moran’s I statistic) in dependent and independent variables.
Dependent Model Variables |
Moran’s I |
P-value |
|
Ligustrum sinense |
|
|
|
|
Mortality (number alive) |
0.27 |
0.03 |
|
Mass (g) |
0.27 |
0.04 |
|
Height (cm) |
0.04 |
0.33 |
|
Stem Diameter (mm) |
0.11 |
0.21 |
|
Number of leaves |
0.22 |
0.08 |
Lonicera maackii |
|
|
|
|
Mortality |
0.06 |
0.27 |
|
Mass (g) |
0.28 |
0.05 |
|
Height (cm) |
0.17 |
0.73 |
|
Stem Diameter (mm) |
- 0.08 |
0.56 |
|
Number of leaves |
- 0.008 |
0.42 |
Rhamnus dauverica |
|
|
|
|
Mortality |
- 0.10 |
0.66 |
|
Mass (g) |
0.008 |
0.39 |
|
Height (cm) |
0.14 |
0.11 |
|
Stem Diameter (mm) |
0.23 |
0.03 |
|
Number of leaves |
0.06 |
0.27 |
Independent Model Variables |
|
|
|
|
PC1 plot (soil moisture and soil pH axis) |
0.60 |
< 0.001 |
|
PC2 plot (light axis) |
0.57 |
< 0.001 |
|
PC1 shrub (shrub size axis) |
0.43 |
0.002 |
|
PC2 shrub (shrub shape axis, number of stems) |
- 0.02 |
0.44 |
Table A3. Standardized regression coefficients and AIC scores from reduced mixed effect models (MEM) and simultaneous autoregressive error models (SARerr) examining effects of parent invasive shrub identity (Ligustrum sinense, Lonicera maackii, or Rhamnus davurica), plot environmental variation (PC1 plot [soil moisture and pH], PC2 plot [light availability]), and shrub characteristics (PC1 shrub [shrub size], PC2 shrub [shrub shape-number of stems]) explain seedling performance (mass, height, stem diameter, number of leaves) and mortality of seedlings of each species after one year of growth in a field plant–soil feedback experiment. Note that for mortality (number alive) these are not standardized regression coefficients because we used a generalized linear model with a Poisson error distribution and a log link function. Asterisks (*) denote the following p values: ‡ α < 0.1; * α < 0.05; ** α < 0.01; *** α < 0.001.
a. Ligustrum sinense (Chinese privet)
|
Mass |
Height |
Stem Diameter |
Number of Leaves |
Survival |
|||||
|
MEM |
SARerr |
MEM |
SARerr |
MEM |
SARerr |
MEM |
SARerr |
MEM |
SARerr |
Intercept |
0.03 |
0.02 |
5.79 |
7.06 |
0.90 |
0.76 |
9.88 |
10.51 |
1.10 |
2.99 |
L. maackii plot |
0.01* |
0.01* |
0.71 |
0.67‡ |
0.18** |
0.19*** |
1.49‡ |
1.47* |
- 0.14 |
- 0.55 |
R. davurica plot |
0.01 |
0.01 |
0.71 |
0.67 |
0.12* |
0.12* |
0.43 |
0.42 |
0.31 |
0.83 |
PC1 shrub |
0.01 |
0.01 |
-- |
-- |
-- |
-- |
-- |
-- |
-- |
-- |
PC2 shrub |
-- |
-- |
-- |
-- |
0.21** |
0.20*** |
-- |
-- |
-- |
-- |
PC1 plot |
0.01* |
0.01* |
1.10* |
1.23*** |
-- |
-- |
2.12** |
2.24** |
-- |
-- |
PC2 plot |
0.02‡ |
0.01‡ |
0.94 |
1.21 |
-- |
-- |
-- |
-- |
1.55*** |
4.23** |
Moran’s I |
0.02 |
- 0.04 |
- 0.17 |
- 0.05 |
0.08 |
- 0.01 |
- 0.17 |
- 0.12 |
- 0.14 |
- 0.11 |
AIC |
- 107.27 |
- 163.42 |
79.67 |
78.47 |
- 14.23 |
- 32.79 |
105.19 |
107.98 |
134.50 |
139.41 |
b. Lonicera maackii (bush honeysuckle)
|
Mass |
Height |
Stem Diameter |
Number of Leaves |
Survival |
|||||
|
MEM |
SARerr |
MEM |
SARerr |
MEM |
SARerr |
MEM |
SARerr |
MEM |
SARerr |
Intercept |
0.01 |
0.01 |
5.40 |
6.73 |
0.64 |
0.69 |
6.37 |
06.26 |
0.44 |
2.44 |
L. sinense plot |
- 0.0003 |
- 0.0002 |
- 0.08 |
- 0.24 |
- 0.18‡ |
- 0.19* |
0.23 |
0.24 |
0.48 |
0.88 |
R. davurica plot |
0.0001 |
- 0.003 |
0.15 |
- 0.12 |
- 0.004 |
- 0.008 |
0.95 |
0.96 |
- 0.19 |
- 0.67 |
PC1 shrub |
- 0.003 |
- 0.003 |
- 1.43 |
- 1.72* |
- 0.20‡ |
- 0.22* |
-- |
-- |
-- |
-- |
PC2 shrub |
- 0.005 |
- 0.005 |
- 1.57 |
- 1.24‡ |
-- |
-- |
-- |
-- |
-- |
-- |
PC1 plot |
-- |
-- |
-- |
-- |
0.13 |
0.12 |
-- |
-- |
- 1.10** |
- 2.24 ** |
PC2 plot |
-- |
-- |
-- |
-- |
-- |
-- |
- 1.14 |
- 1.15 |
-- |
-- |
Moran’s I |
0.01 |
- 0.05 |
- 0.22 |
- 0.07 |
- 0.06 |
0.01 |
0.01 |
0.001 |
- 0.18 |
- 0.16 |
AIC |
- 111.24 |
- 162.23 |
94.47 |
293.93 |
8.96 |
- 11.19 |
105.64 |
105.63 |
114.30 |
126.6 |
c. Rhamnus davurica (Dahurian buckthorn)
|
Mass |
Height |
Stem Diameter |
Number of Leaves |
Survival |
|||||
|
MEM |
SARerr |
MEM |
SARerr |
MEM |
SARerr |
MEM |
SARerr |
MEM |
SARerr |
Intercept |
0.05 |
-0.06 |
10.14 |
10.35 |
0.97 |
1.06 |
6.72 |
7.37 |
2.22 |
9.97 |
L. maackii plot |
0.003 |
0.003 |
0.45 |
0.46 |
- 0.04 |
- 0.05 |
- 0.14 |
- 0.14 |
- 0.33 * |
- 2.48 ** |
L. sinense plot |
0.002 |
0.002 |
0.07 |
0.07 |
- 0.02 |
- 0.02 |
- 0.19 |
- 0.20 |
- 0.25 |
- 1.92 * |
PC1 shrub |
- 0.009 |
- 0.009 |
- 1.54* |
- 1.57 * |
- 0.11 |
- 0.12‡ |
-- |
-- |
-- |
-- |
PC2 shrub |
-- |
-- |
-- |
-- |
-- |
-- |
-- |
-- |
-- |
-- |
PC1 plot |
-- |
-- |
-- |
-- |
-- |
-- |
0.64** |
0.66 ** |
0.15 |
0.97 |
PC2 plot |
-- |
-- |
-- |
-- |
- 0.38** |
- 0.39 *** |
0.42 |
0.43 |
0.27 |
0.22 |
Moran’s I |
- 0.09 |
- 0.04 |
- 0.11 |
- 0.10 |
- 0.56 |
- 0.09 |
- 0.08 |
0.04 |
- 0.09 |
0.03 |
AIC |
- 126.16 |
- 161.36 |
111.11 |
112.51 |
- 24.56 |
- 19.80 |
48.59 |
53.53 |
140.72 |
142.46 |
Table A4. Mean and standard error of plant growth metrics from a greenhouse plant–soil feedback experiment.
Ligustrum sinense |
|||||||
|
Soil Type |
shoot |
root |
shoot:root |
total |
height |
# leaves |
|
Ligustrum |
0.40 ± 0.04 |
0.52 ± 0.06 |
0.80 ± 0.03 |
0.91 ± 0.10 |
18.29 ± 2.60 |
42.47 ± 4.97 |
|
Lonicera |
0.43 ± 0.06 |
0.60 ± 0.06 |
0.71 ± 0.03 |
1.03 ± 0.12 |
18.33 ± 1.63 |
36.47 ± 4.93 |
|
Uninvaded |
0.38 ± 0.10 |
0. 57 ± 0.13 |
0.65 ± 0.04 |
0.96 ± 0.23 |
19.23 ± 3.99 |
40.17 ± 8.85 |
|
Sterile |
0.08 ± 0.01 |
0.11 ± 0.01 |
0.76 ± 0.06 |
0.19 ± 0.02 |
7.21 ± 0.55 |
8.87 ± 0.98 |
Lindera benzoin |
|||||||
|
Soil Type |
shoot |
root |
shoot:root |
total |
height |
# leaves |
|
Ligustrum |
0.25 ± 0.04 |
0.59 ± 0.08 |
0.42 ± 0.01 |
0.83 ± 0.12 |
8.73 ± 0.85 |
4.93 ± 0.45 |
|
Lonicera |
0.29 ± 0.03 |
0.59 ± 0.06 |
0.50 ± 0.04 |
0.88 ± 0.09 |
8.58 ± 0.72 |
4.21 ± 0.54 |
|
Uninvaded |
0.23 ± 0.07 |
0.62 ± 0.16 |
0.37 ± 0.03 |
0.85 ± 0.22 |
7.88 ± 1.13 |
4.33 ± 1.23 |
|
Sterile |
0.15 ± 0.01 |
0.38 ± 0.03 |
0.40 ± 0.02 |
0.53 ± 0.04 |
7.07 ± 0.36 |
1.53 ± 0.36 |
Lonicera maackii |
|||||||
|
Soil Type |
shoot |
root |
shoot:root |
total |
height |
# leaves |
|
Ligustrum |
0.20 ± 0.04 |
0.28 ± 0.05 |
0.72 ± 0.05 |
0.48 ± 0.08 |
8.53 ± 1.14 |
19.60 ± 1.63 |
|
Lonicera |
0.28 ± 0.05 |
0.41 ± 0.06 |
0.67 ± 0.02 |
0.69 ± 0.11 |
10.95 ± 1.41 |
21.80 ± 2.04 |
|
Uninvaded |
0.36 ± 0.09 |
0.48 ± 0.12 |
0.72 ± 0.03 |
0.84 ± 0.21 |
12.98 ± 2.23 |
26.67 ± 3.33 |
|
Sterile |
0.03 ± 0.01 |
0.05 ± 0.01 |
0.63 ± 0.04 |
0.08 ± 0.01 |
3.15 ± 0.21 |
5.47 ± 0.61 |
Rhamnus davurica |
|||||||
|
Soil Type |
shoot |
root |
shoot:root |
total |
height |
# leaves |
|
Ligustrum |
0.38 ± 0.05 |
0.67 ± 0.07 |
0.56 ± 0.03 |
1.05 ± 0.11 |
8.81 ± 0.61 |
11.07 ± 0.79 |
|
Lonicera |
0.32 ± 0.05 |
0.52 ± 0.07 |
0.61 ± 0.04 |
0.84 ± 0.12 |
8.29 ± 0.67 |
9.67 ± 0.75 |
|
Uninvaded |
0.19 ± 0.04 |
0.43 ± 0.08 |
0.43 ± 0.04 |
0.62 ± 0.11 |
5.53 ± 0.63 |
8.50 ± 1.20 |
|
Sterile |
0.11 ± 0.01 |
0.21 ± 0.03 |
0.53 ± 0.02 |
0.32 ± 0.04 |
5.72 ± 0.32 |
4.38 ± 0.38 |
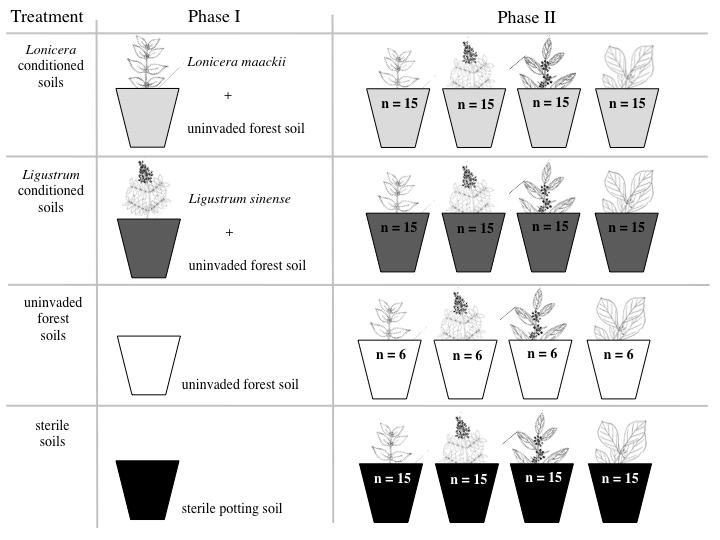
Fig. A1. Experimental design of greenhouse plant–soil feedback experiment. The four species used in Phase II are the following (from left to right): Lonicera maackii, Ligustrum sinense, Rhamnus davurica, and Lindera benzoin.
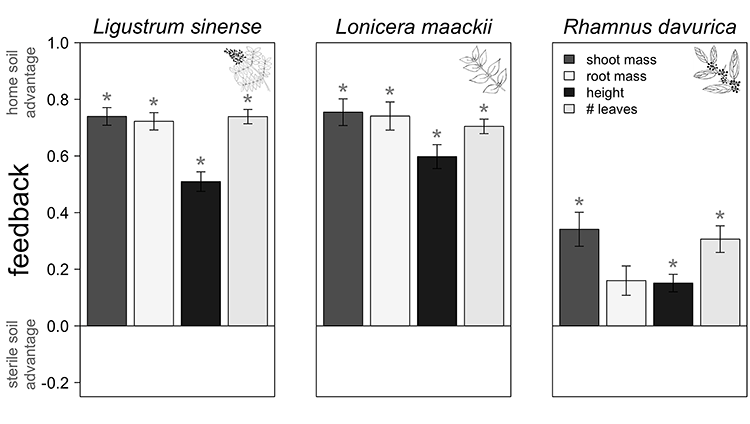
Fig. A2. The nonnative shrubs Ligustrum sinense (Chinese privet), Lonicera maackii (bush honeysuckle),and Rhamnus davurica (Dahurian buckthorn)performed better in ‘live’ soils conditioned by a conspecific compared to sterilized soils in a greenhouse experiment. Error bars are 95% confidence intervals from feedback calculations and asterisks represent significance (P < 0.05) from a priori orthogonal contrast tests.
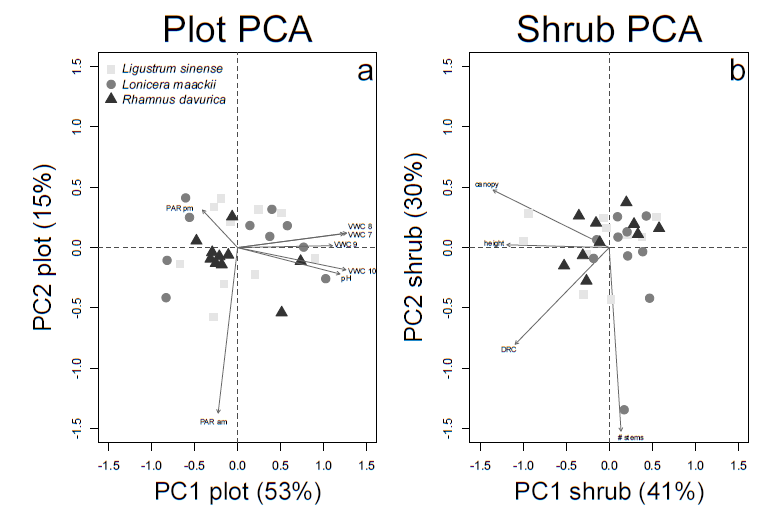
Fig. A3. Plots of the first two principal component (PC) axes used to describe variation among field plots in terms of environmental conditions (a, Plot PCA) and stature of the center mature nonnative shrub (b, Shrub PCA). Lines represent variables used in each PCA (afternoon understory photosynthetic active radiation [PAR pm]; morning understory photosynthetic active radiation [PAR am]; soil pH [pH]; and soil volumetric water content in July [VWC 7], August [VWC 8], September [VWC 9], October [VWC 10]; shrub canopy size [canopy]; shrub height [height]; shrub diameter at root collar [DRC]; and shrub number of stems [# stems]) and points represent a plot type as defined by the mature shrub in the plot.