Ecological Archives E096-194-A2
A. Coulon, J. Aben, S. C. F. Palmer, V. M. Stevens, T. Callens, D. Strubbe, L. Lens, E. Matthysen, M. Baguette, and J. M. J. Tavis. 2015. A stochastic movement simulator improves estimates of landscape connectivity. Ecology 96:22032213. http://dx.doi.org/10.1890/14-1690.1
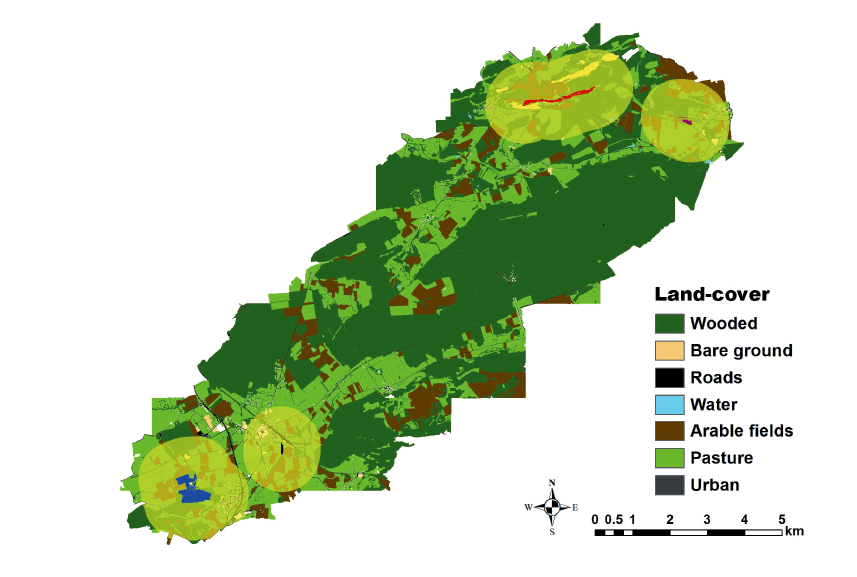
Appendix B. Map of the natterjack toad study area located in southern Belgium.
Fig. B1. Map of the natterjack toad study area located in southern Belgium. Following Stevens et al. (2006), land cover classes were digitized as a raster layer at 3-m resolution, and costs based on relative preference were applied (wooded 41.05, bare ground 41.18, roads 45.33, water 50.00, arable fields 62.50, pasture 66.03, urban 1000.00). The partially transparent yellow areas are 1km buffer regions around each of the four breeding sites (individually colored). Also following Stevens et al. (2006), North-West population = MER; NE = ROM; SW = FLC; SE = MAR.
Literature cited
Stevens, V. M., C. Verkenne, S. Vandewoestijne, R. A. Wesselingh, and M. Baguette. 2006. Gene flow and functional connectivity in the natterjack toad. Molecular Ecology 15:2333–2344.