Ecological Archives E096-193-A1
Justin C. Touchon, Michael W. McCoy, Tobias Landberg, James R. Vonesh, and Karen M. Warkentin. 2015. Putting µ/g in a new light: plasticity in life history switch points reflects fine-scale adaptive responses. Ecology 96:21922202. http://dx.doi.org/10.1890/14-1301.1
Appendix A. Details on the structure of statistical models used in the analyses and three figures showing predation on tadpoles and/or metamorphs after our second census, the relationship between density of tadpoles in mesocosms and resulting SVL of metamorphs, and the predator-induced variation in developmental stages of metamorphs at emergence from the water.
Table A1. Structure of linear and generalized linear mixed models (LMM and GLMM) used in analyses. See text for explanation of fixed and random effects. All random effects are for random intercept except as otherwise noted. Sample sizes may vary across models due to outliers being excluded that caused poor model fit or had undue leverage or because data were not complete for all individuals due to occasional mortality during tail resorption.
Model |
N |
Response |
Fixed effects |
Random effects |
Error distribution |
Larval survival |
122 |
# tadpoles alive out of starting number |
Time, |
Block, Time (random slope) |
Binomial |
Larval size |
4264* |
log (total tadpole length) |
Time, |
Block, Tank nested within Block, Time (random slope) |
Gaussian |
Survival to metamorphosis |
61 |
# metamorphs emerged per tank |
Hatching age, Metamorph predator, |
Block, Tank nested within Block |
Binomial |
Predation after 2nd census |
61 |
# individuals killed (or missing) per tank |
Larval predator, |
Block |
Gaussian |
Time to metamorphosis |
2191 |
log (Age at metamorphosis) |
Hatching age, |
Block, Tank nested within Block |
Gaussian |
Size at metamorphosis |
2172 |
log (SVL at emergence) |
Hatching age, |
Block, Tank nested within Block |
Gaussian |
Mean size at metamorphosis (effects of thinning) |
61 |
log (SVL at emergence) – mean per tank |
Larval predator, |
Block |
Gaussian |
Tail length at emergence |
2191 |
log (Tail length) |
Hatching age, |
Block, Tank nested within Block |
Gaussian |
Duration of metamorphosis |
2181 |
log (# days from emergence to Gosner stage 46) |
Hatching age, |
Block, Tank nested within Block |
Gaussian |
* Not all tadpoles visible in photos could be accurately measured, and thus the number of tadpoles used for length measurements at each time point is fewer than the number counted for measurements of survival.
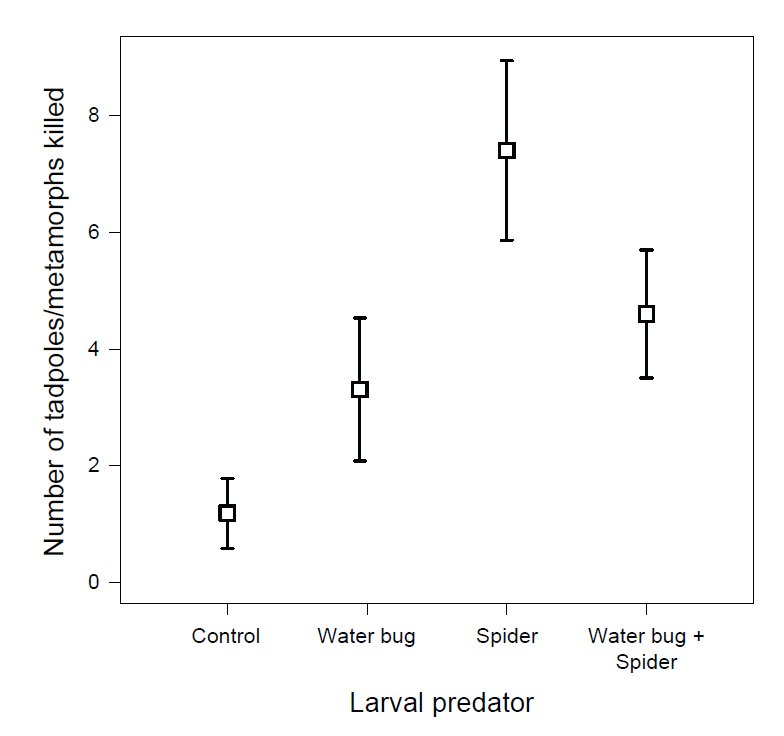
Fig. A1. Predation on Agalychnis callidryas after the second census (at 22 days post-oviposition) was greatest in tanks containing only spider predators. Tanks containing both spiders and water bugs, or only water bugs did not differ. Mortality in the control tanks was minimal. In tanks with both spiders and bugs we cannot separate predation on tadpoles or on emerging metamorphs. Data shown are the number of individuals consumed per tank ± 95% confidence intervals, controlling for random effects of variation between blocks and tanks within blocks.
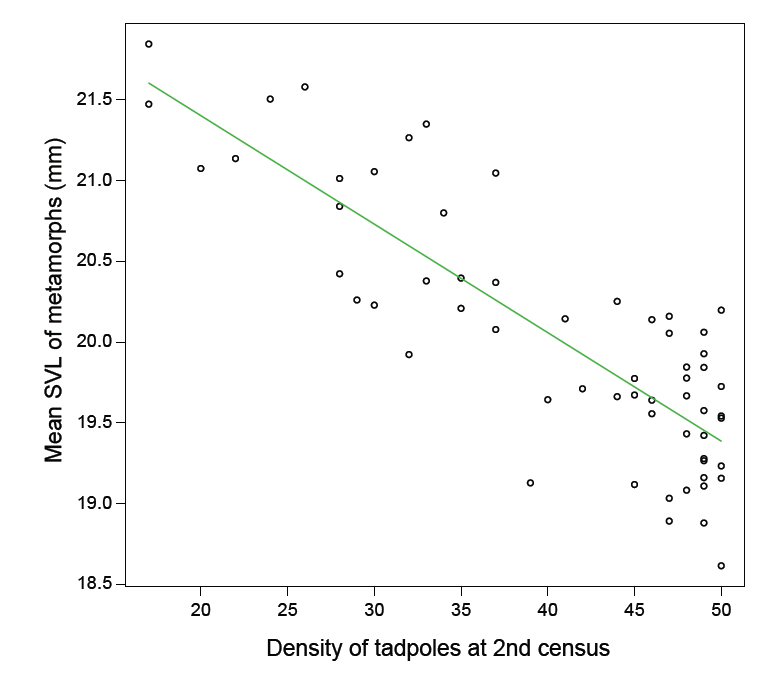
Fig. A2. The snout-vent length (SVL) of Agalychnis callidryas at metamorphosis was strongly related to the amount of predation by water bugs during the larval period. The figure shows the density of tadpoles alive in a given tank at 22 days post-oviposition plotted against the mean SVL (mm) of the metamorphs that emerged from that tank. SVL was measured at full tail resorption. Tanks that had more tadpoles alive at 22 days also had, on average, smaller metamorphs. The green line represents a best fit line from a linear mixed model accounting for block effects.
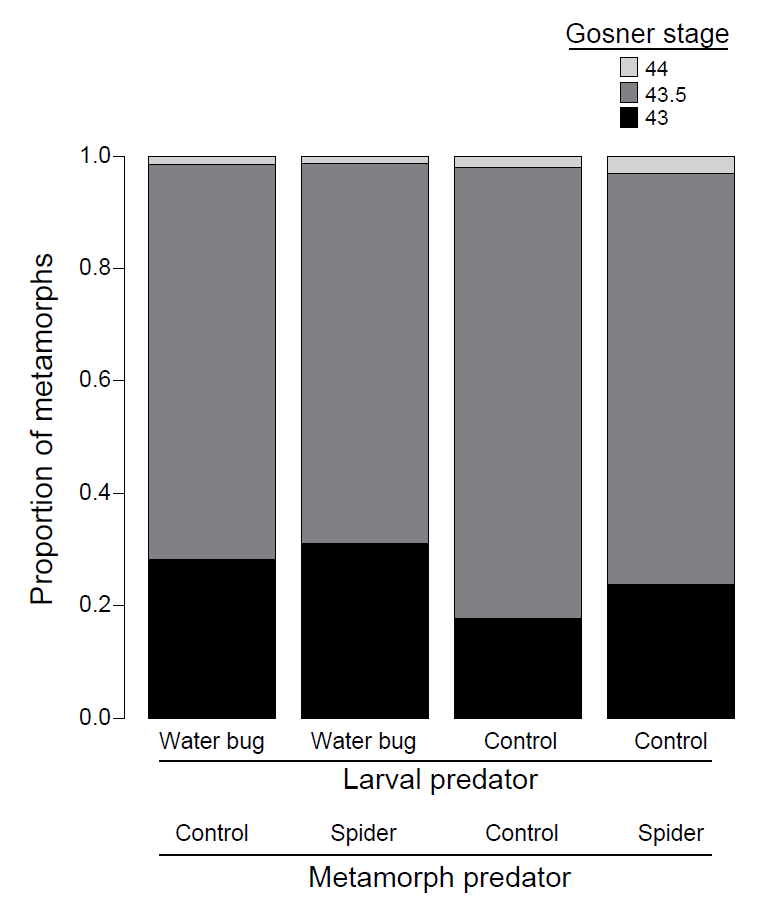
Fig. A3. The proportions of metamorphs emerging at different stages of development (Gosner 1960). Metamorphs emerged at stage 43 (corner of mouth approximately even with nares), 43.5 (corner of the mouth more than halfway from nare to eye), or 44 (corner of mouth even with center of eye). Metamorphs were raised in a factorial cross of larval predators (water bugs) or predator-free controls, and metamorph predators (fishing spiders) or predator-free controls.