Ecological Archives E096-192-A7
María C. Rodríguez-Rodríguez, Pedro Jordano, and Alfredo Valido. 2015. Hotspots of damage by anatgonists shape the spatial structure of plantpollinator interactions. Ecology 96:21812191. http://dx.doi.org/10.1890/14-2467.1
Appendix G. Description of the methodology used to estimate the length of interplant flights by bird pollinators, and results obtained per bird species.
Methods
Simultaneously to plant monitoring, we performed focal censuses on Phylloscopus canariensis (Hartwig, 1886) (Phylloscopidae) and Cyanistes teneriffae (Lesson, 1831) (Paridae) to characterize the movement pattern of bird pollinators among individual plants of Isoplexis canariensis (L.) J. W. Loudon (Plantaginaceae). For this, we recorded bird movements by direct watches for a total of 257 h over 34 days in the two study patches, from 09.00 to 21.00 h. The vegetation had an open structure over most of the study patches, which facilitated bird observation with binoculars from the patch corner. Once a bird had begun feeding within the patch, we recorded with a hand held dictaphone (i) the bird species, (ii) the identity of the visited plant, and (iii) whether the bird left the patch or moved to another tagged plant to probe more flowers. In the latter case, the second plant was noted and the sequence of visited plants continued. Those plants in which the bird perched without probing at least one flower were excluded from the sequence.
Each foraging sequence was later discretized into steps (plant-to-plant movement) to estimate the linear distance between two consecutively visited plants (step length). The sequence discretization let us compute for each bird pollinator species the following values (adehabitatLT package in R, Calenge 2006): (1) number of steps per sequence, and (2) interplant distances (step length) measured as the Euclidean distance (cm) between two consecutive visited plants. Then, we pooled all steps per pollinator to calculate the average distance flown between plants and its frequency distribution.
Results
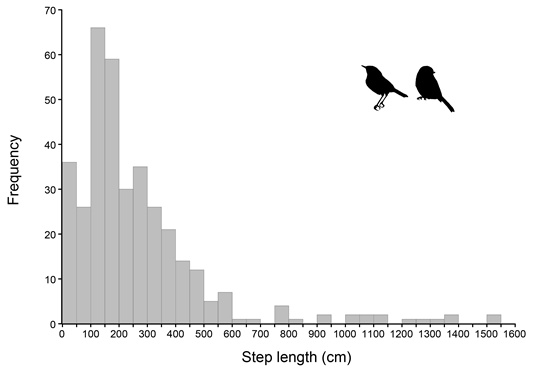
We recorded a total of 168 foraging sequences in the two study patches with > 1 visited plants. The passerine P. canariensis accounted for most of them (n = 153 sequences), whereas C. teneriffae was a less frequent visitor (n = 15 sequences). Most of plant-to-plant movements (steps) were 100–200 cm long (Fig. G1). The mean step length from the pooled data was 266.2 ± 250.2 cm (median: 196.5 cm; Fig. G1), which exceeds the average distance to the nearest plant neighbor in the two study patches (70.3 ± 66.4 cm). There was a large overlap in the range of step length between P. canariensis (2.2–1,545.1 cm) and C. teneriffae (46.2–1,545.1 cm). However, C. teneriffae (375.7 ± 387.6 cm) tended to fly longer distances between consecutive plants than those of P. canariensis (259.1 ± 237.7 cm).
Fig. G1. Frequency distribution of plant-to-plant movements (steps) from the pooled data from Phylloscopus canariensis and Cyanistes teneriffae classified by step length (cm). The total number of recorded steps was 359 (P. canariensis n = 337, C. teneriffae n = 22). Black silhouettes: P. canariensis on the left, C. teneriffae on the right.
Literature cited
Calenge, C. 2006. The package “adehabitat” for the R software: a tool for the analysis of space and habitat use by animals. Ecological Modelling 197:516–519.