Ecological Archives E096-184-A1
Anna Runemark, Kostas Sagonas, and Erik I. Svensson. 2015. Ecological explanations to island gigantism: dietary niche divergence, predation and size in an endemic lizard. Ecology 96:20772092. http://dx.doi.org/10.1890/14-1996.1
Appendix A. Supporting methods and results for ecological explanations to island gigantism.
Table A1. FST between all islet populations and the population on the main island they are least genetically diverged from as well as the islet population that they are least diverged from. For all islet populations, genetic distance to the mainland population is lower than that to any other islet population. Hence, these islets constitute independent replicas.
Islet |
Least diverged |
FST main island |
Least diverged islet population |
FST Islet |
AM |
MO |
0.15 |
DII |
0.25 |
D |
PA |
0.10 |
DII |
0.15 |
DII |
N |
0.06 |
D |
0.15 |
IA |
KP |
0.08 |
KO |
0.19 |
KO |
KP |
0.09 |
R |
0.13 |
L |
PA |
0.14 |
DII |
0.21 |
R |
R |
0.06 |
KO |
0.13 |
Table A2. Pairwise FST-values between all population pairs. Significant FST-estimates are demarked by bold, italicized text. Indicative adjusted nominal level (5%) for multiple comparisons is 0.000476.
AA |
AM |
AT |
D |
KO |
KP |
L |
MO |
N |
PA |
PE |
R |
X |
AF |
DII |
|
AA |
0.00 |
0.16 |
0.04 |
0.11 |
0.12 |
0.03 |
0.20 |
0.04 |
0.01 |
0.04 |
0.02 |
0.06 |
0.12 |
0.07 |
0.10 |
AM |
0.16 |
0.00 |
0.19 |
0.30 |
0.29 |
0.17 |
0.32 |
0.15 |
0.17 |
0.20 |
0.16 |
0.24 |
0.27 |
0.21 |
0.25 |
AT |
0.04 |
0.19 |
0.00 |
0.11 |
0.11 |
0.01 |
0.20 |
0.06 |
0.04 |
0.02 |
0.02 |
0.09 |
0.09 |
0.08 |
0.13 |
D |
0.11 |
0.30 |
0.11 |
0.00 |
0.21 |
0.10 |
0.28 |
0.16 |
0.13 |
0.10 |
0.13 |
0.17 |
0.20 |
0.16 |
0.20 |
KO |
0.12 |
0.29 |
0.11 |
0.21 |
0.00 |
0.09 |
0.24 |
0.12 |
0.14 |
0.13 |
0.12 |
0.13 |
0.19 |
0.17 |
0.23 |
KP |
0.03 |
0.17 |
0.01 |
0.10 |
0.09 |
0.00 |
0.16 |
0.04 |
0.05 |
0.02 |
0.02 |
0.07 |
0.08 |
0.07 |
0.12 |
L |
0.20 |
0.32 |
0.20 |
0.28 |
0.24 |
0.16 |
0.00 |
0.18 |
0.20 |
0.22 |
0.19 |
0.24 |
0.25 |
0.24 |
0.32 |
MO |
0.04 |
0.15 |
0.06 |
0.16 |
0.12 |
0.04 |
0.18 |
0.00 |
0.06 |
0.08 |
0.05 |
0.09 |
0.13 |
0.13 |
0.16 |
N |
0.01 |
0.17 |
0.04 |
0.13 |
0.14 |
0.05 |
0.20 |
0.06 |
0.00 |
0.05 |
0.02 |
0.09 |
0.13 |
0.08 |
0.12 |
PA |
0.04 |
0.20 |
0.02 |
0.10 |
0.13 |
0.02 |
0.22 |
0.08 |
0.05 |
0.00 |
0.04 |
0.06 |
0.12 |
0.06 |
0.11 |
PE |
0.02 |
0.16 |
0.02 |
0.13 |
0.12 |
0.02 |
0.19 |
0.05 |
0.02 |
0.04 |
0.00 |
0.09 |
0.10 |
0.07 |
0.12 |
R |
0.06 |
0.24 |
0.09 |
0.17 |
0.13 |
0.07 |
0.24 |
0.09 |
0.09 |
0.06 |
0.09 |
0.00 |
0.16 |
0.12 |
0.16 |
X |
0.12 |
0.27 |
0.09 |
0.20 |
0.19 |
0.08 |
0.25 |
0.13 |
0.13 |
0.12 |
0.10 |
0.16 |
0.00 |
0.16 |
0.22 |
AF |
0.07 |
0.21 |
0.08 |
0.16 |
0.17 |
0.07 |
0.24 |
0.13 |
0.08 |
0.06 |
0.07 |
0.12 |
0.16 |
0.00 |
0.08 |
DII |
0.10 |
0.25 |
0.13 |
0.20 |
0.23 |
0.12 |
0.32 |
0.16 |
0.12 |
0.11 |
0.12 |
0.16 |
0.22 |
0.08 |
0.00 |
Table A3. Sample sizes for different types of analyses. Population names are given in the first column, and the population abbreviations that are displayed on the map in Fig. 1 are given in parenthesis. The habitat type of the populations is given in the second column; mainland populations are denoted by (M) and islet populations by (I). First we report the number of pitfall traps per population. Third, we give the number of images used in the geometric morphometric analysis.
Population (abbreviation) |
Environment type |
Fecal samples M/F |
Pitfall traps |
Profile photos |
Dorsal photos |
Morphology M/F |
Agios Athanateus (AA) |
M |
|
0 |
40 |
40 |
21/19 |
Agiar Molau (AM) |
I |
|
0 |
36 |
0 |
11/22 |
Atsitsa (AT) |
M |
|
0 |
37 |
0 |
31/27 |
Kotsiles (KO) |
I |
|
0 |
37 |
37 |
16/20 |
Kyria Panagia (KP) |
M |
|
0 |
34 |
34 |
19/15 |
Molos (MO) |
M |
|
0 |
33 |
0 |
17/17 |
Palamari (PA) |
M |
8/6 |
0 |
44 |
44 |
21/17 |
Pefkos (PE) |
M |
|
0 |
55 |
22 |
36/29 |
Erinia (R) |
I |
|
0 |
29 |
19 |
8/9 |
Island of Atsitsa (IA) |
I |
2/5 |
0 |
35 |
15 |
17/19 |
Agios Fokas (AF) |
M |
7/7 |
7 |
46 |
42 |
31/36 |
Mesa Diavates (D) |
I |
9/7 |
12 |
78 |
32 |
57/45 |
Lakonisi (L) |
I |
9/8 |
7 |
86 |
60 |
60/47 |
Nyfi (N) |
M |
14/10 |
16 |
115 |
49 |
78/70 |
Exo Diavates (DII) |
I |
4/5 |
7 |
0 |
0 |
27 |
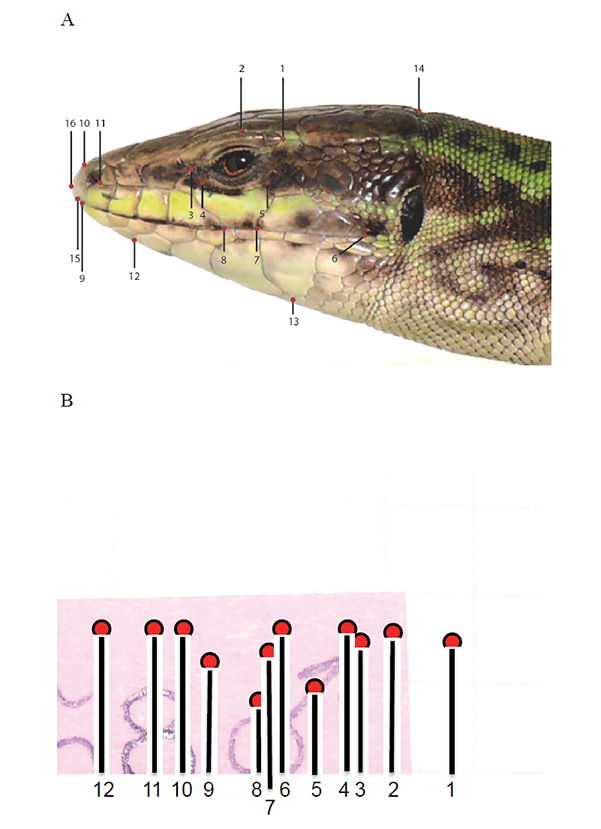
Fig. A1. Landmarks. (A) For analysis of lateral view. 1) posterior border of the last supraocular 2) joint between 3rd and 4th supraocular, 3) anterior border of first supraocular 4) anterior border of the subocular, 5) posterior upper border of the subocular, 6) end of the mouth opening; posterior border of the last supralabial, 7) posterior lower border of the rostral, 8) anterior lower border of the subocular, 9), 15) extreme of the lower and upper jaw, respectively, 10) posterior border of the rostral, 11) joint of the rostral, the postnasal and the supralabial that borders it, 12) posterior border of the 2nd chin shield, 13) anterior border of the last chin shield, 14) joint of the last supratemporal and the parietal and 16) Point of maximum curvature on the tip of the snout. (B) For analysis of the dorsal view. 1) Posterior border of the occipital, 2) posterior border of the interparietal, 3) middle-anterior border of the interparietal, 4) anterior border of the interparietal, 5) lateral border of the frontoparietal, 6) posterior border of the frontal, 7) middle-posterior border of the frontal, 8) joint of the two middle supraoculars and the supraciliary granules, 9) middle-anterior borders of the frontal, 10) anterior border of the frontal, 11) posterior border of the frontonasal and 12) anterior border of the frontonasal.
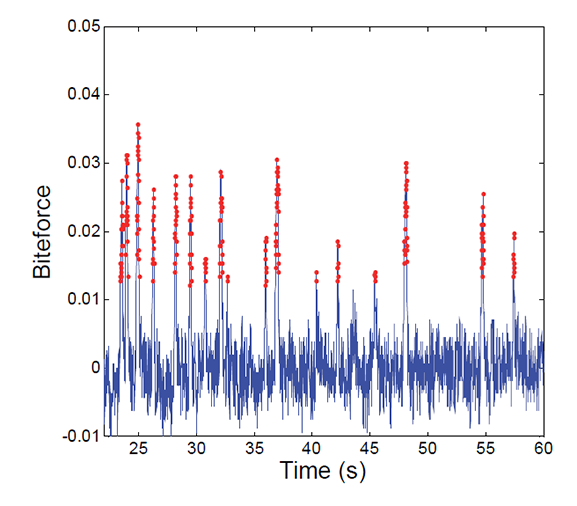
Fig. A2. Bite force measurement. Time is plotted on the x-axis and bite intensity on the y-axis. The instances defined as bite events by the script are marked by red dots. The script then identifies the peak of these bite events, and the median of these peaks is used in the analyses.
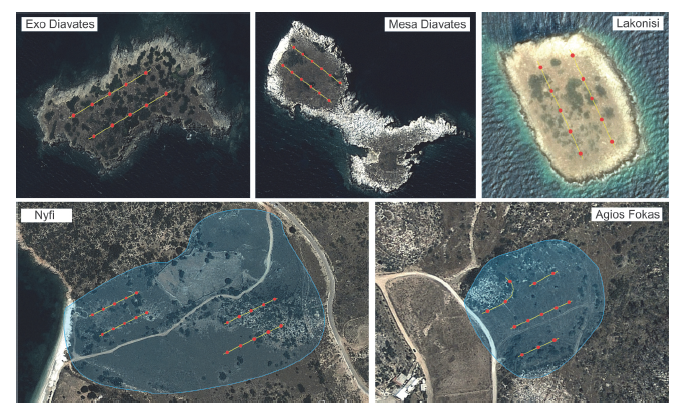
Fig. A3. Pitfall traps arrangement at the five localities under study. 10 traps were placed on the islets of Exo Diavates and Lakonisi, 12 on Mesa Diavates, 20 at Nyfi (Skyros Island) and 13 at Agios Fokas (Skyros Island), of which 7, 7, 12, 16 and 7, respectively, were analyzed, since the rests were damaged due to grazing or human activity.
Table A4. Relationship between the logarithm of head length and the logarithm of overall body size (SVL), sex and habitat of origin.
Effect |
df |
Error df |
F |
P |
Habitat |
1 |
805 |
7.0 |
0.022 |
Sex |
1 |
805 |
850.2 |
<0.001 |
Snout-vent length |
1 |
805 |
2927 |
<0.001 |
Habitat × Sex |
1 |
805 |
0.4 |
0.54 |
Habitat × Snout-vent length |
1 |
805 |
7.1 |
0.008 |
Sex × Snout-vent length |
1 |
805 |
61.7 |
<0.001 |
Habitat × Sex × Snout-vent length |
1 |
805 |
4.2 |
0.041 |
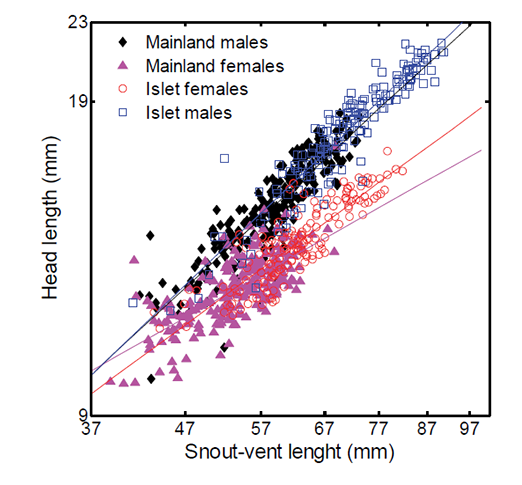
Fig. A4. Head length as function of snout-vent length for islet males (empty blue squares: head width), mainland males (filled black diamonds) islet females (empty red circles) and mainland females (filled pink triangles).
Table A5. The effect of logarithm of morphological variables, environment and population on the logarithm of bite force. First (I), full models, and then (II), the reduced models where nonsignificant variables are removed through sequential backwards deletion, are presented. (A) The effects of head width on bite force and (B) the effects of head length on bite force.
Effect |
df |
t |
P |
AI) Head width, full model, AIC= -108.11 |
|
|
|
Environment |
11 |
0.74 |
0.87 |
Log(Head length) |
123 |
5.06 |
<0.001 |
Environment× Log(Head length) |
123 |
-0.89 |
0.37 |
AII) Head width, reduced model, AIC= -108.85 |
|
|
|
Environment |
11 |
-1.77 |
0.10 |
Log(Head width) |
124 |
6.22 |
<0.001 |
BI) Head length, full model, AIC= -107.61 |
|
|
|
Environment |
11 |
0.67 |
0.52 |
Log(Head length) |
123 |
5.26 |
<0.001 |
Environment× Log(Head length) |
123 |
-0.77 |
0.44 |
BII) Head length, reduced model, AIC= -108.31 |
|
|
|
Environment |
11 |
-1.67 |
0.12 |
Log(Head length) |
124 |
6.31 |
<0.001 |
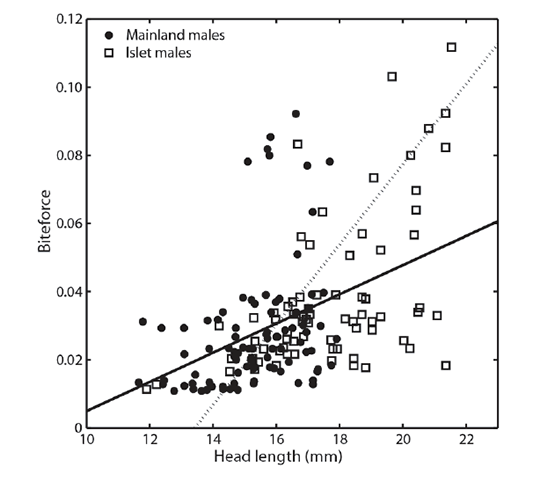
Fig. A5. Bite force of the Skyros wall lizard as a function of head length. Log(islet biteforce) = -4.72 ± 2.60×log(head length); log(mainland biteforce) = -4.19 ± 2.11×log(head length).
Table A6. Diet composition of Podarcis gaigeae from three mainland (Skyros Island) and four islet populations pooled for males and females. As in Fig. 3A. %n refers to the percentage of prey items in the stomachs (based on number of preys); f refers to the proportion lizards which have eaten the prey.
Prey items |
D |
DII |
L |
IA |
N |
AF |
PA |
|||||||
n% |
f |
n% |
f |
n% |
f |
n% |
f |
n% |
f |
n% |
f |
n% |
f |
|
Araneae |
3.61 |
0.13 |
7.84 |
0.44 |
7.32 |
0.29 |
5.41 |
0.29 |
10.1 |
0.21 |
5.45 |
0.21 |
8.33 |
0.29 |
Opiliones |
‑ |
- |
3.92 |
0.22 |
- |
- |
8.11 |
0.29 |
5.62 |
0.13 |
3.64 |
0.14 |
5.00 |
0.14 |
Orthoptera |
9.64 |
0.44 |
3.92 |
0.22 |
4.88 |
0.18 |
10.81 |
0.29 |
3.37 |
0.13 |
5.45 |
0.21 |
- |
- |
Helicidae |
3.61 |
0.13 |
1.96 |
0.11 |
3.66 |
0.18 |
5.41 |
0.29 |
- |
- |
- |
- |
- |
- |
Homoptera |
3.61 |
0.13 |
7.84 |
0.33 |
6.10 |
0.24 |
2.70 |
0.14 |
- |
- |
3.64 |
0.07 |
3.33 |
0.14 |
Hemiptera |
1.20 |
0.06 |
5.88 |
0.33 |
3.66 |
0.12 |
2.70 |
0.14 |
- |
- |
- |
- |
1.67 |
0.07 |
Heteroptera |
7.23 |
0.19 |
7.84 |
0.33 |
3.66 |
0.18 |
5.41 |
0.14 |
1.12 |
0.04 |
- |
- |
1.67 |
0.07 |
Diptera |
1.20 |
0.06 |
- |
- |
2.44 |
0.12 |
- |
- |
2.25 |
0.08 |
7.27 |
0.21 |
3.33 |
0.14 |
Isopoda |
9.64 |
0.31 |
7.84 |
0.33 |
7.32 |
0.24 |
8.11 |
0.29 |
2.25 |
0.08 |
- |
- |
3.33 |
0.14 |
Dictyoptera |
1.20 |
0.06 |
1.96 |
0.11 |
3.66 |
0.12 |
- |
- |
3.37 |
0.08 |
- |
- |
- |
- |
Coleoptera |
32.5 |
0.75 |
13.7 |
0.56 |
18.3 |
0.53 |
18.92 |
0.57 |
4.49 |
0.17 |
7.27 |
0.14 |
13.3 |
0.29 |
Hymenoptera |
4.82 |
0.13 |
9.80 |
0.44 |
12.2 |
0.41 |
8.11 |
0.43 |
4.49 |
0.17 |
10.9 |
0.29 |
16.7 |
0.43 |
Formicidae |
10.8 |
0.31 |
21.6 |
0.56 |
17.1 |
0.47 |
13.51 |
0.43 |
53.9 |
0.71 |
36.4 |
0.64 |
38.3 |
0.64 |
Insect larvae |
3.61 |
0.19 |
5.88 |
0.22 |
8.54 |
0.24 |
8.11 |
0.29 |
4.49 |
0.17 |
14.6 |
0.29 |
5.00 |
0.21 |
Others |
7.22 |
0.31 |
- |
- |
1.22 |
0.06 |
2.70 |
0.14 |
4.49 |
0.13 |
5.46 |
0.14 |
- |
- |
Total preys |
83 |
51 |
82 |
37 |
89 |
55 |
60 |
|||||||
Specimens |
16 |
9 |
17 |
7 |
24 |
14 |
14 |
|||||||
Prey/lizard |
5.19 |
5.67 |
4.82 |
5.29 |
3.71 |
3.93 |
4.29 |
|||||||
Shannon-Wiener (H') |
2.32 |
2.37 |
2.41 |
2.41 |
1.75 |
2.03 |
1.91 |
|||||||
Table A7. Diet composition of males Podarcis gaigeae from three mainland (Skyros Island) and four islet populations. %n refers to the percentage of prey items in the stomachs, f refers to the proportion of individuals lizards eaten the prey.
Groups |
D |
DII |
L |
IA |
N |
AF |
PA |
|||||||
n% |
f |
n% |
f |
n% |
f |
n% |
f |
n% |
f |
n% |
f |
n% |
f |
|
Araneae |
4.65 |
0.11 |
8.33 |
0.50 |
8.70 |
0.33 |
7.14 |
0.50 |
7.55 |
0.21 |
6.67 |
0.29 |
5.88 |
0.25 |
Opiliones |
- |
- |
4.17 |
0.25 |
- |
- |
7.14 |
0.50 |
5.66 |
0.07 |
- |
- |
5.88 |
0.13 |
Orthoptera |
6.98 |
0.22 |
4.17 |
0.25 |
6.52 |
0.22 |
14.29 |
0.50 |
1.89 |
0.07 |
6.67 |
0.29 |
- |
- |
Helicidae |
2.33 |
0.11 |
- |
- |
2.17 |
0.11 |
7.14 |
0.50 |
- |
- |
- |
- |
- |
- |
Homoptera |
2.33 |
0.11 |
8.33 |
0.25 |
8.70 |
0.33 |
7.14 |
0.50 |
- |
- |
6.67 |
0.14 |
2.94 |
0.13 |
Hemiptera |
- |
- |
4.17 |
0.25 |
2.17 |
0.11 |
- |
- |
- |
- |
- |
- |
2.94 |
0.13 |
Heteroptera |
9.30 |
0.11 |
8.33 |
0.25 |
4.35 |
0.22 |
- |
- |
- |
- |
- |
- |
2.94 |
0.13 |
Diptera |
- |
- |
- |
- |
2.17 |
0.11 |
- |
- |
1.89 |
0.07 |
3.33 |
0.14 |
2.94 |
0.13 |
Isopoda |
11.63 |
0.33 |
4.17 |
0.25 |
4.35 |
0.11 |
14.29 |
0.50 |
1.89 |
0.07 |
- |
- |
2.94 |
0.13 |
Dictyoptera |
- |
- |
4.17 |
0.25 |
2.17 |
0.11 |
- |
- |
3.77 |
0.07 |
- |
- |
- |
- |
Coleoptera |
34.88 |
0.78 |
12.50 |
0.75 |
19.57 |
0.67 |
7.14 |
0.50 |
5.66 |
0.21 |
6.67 |
0.14 |
17.65 |
0.25 |
Hymenoptera |
4.65 |
0.11 |
8.33 |
0.50 |
8.70 |
0.33 |
7.14 |
0.50 |
5.66 |
0.21 |
10.00 |
0.29 |
14.71 |
0.38 |
Formicidae |
11.63 |
0.33 |
29.17 |
0.75 |
17.39 |
0.44 |
21.43 |
0.50 |
54.72 |
0.71 |
33.33 |
0.57 |
35.29 |
0.50 |
Insect larvae |
2.33 |
0.11 |
4.17 |
0.25 |
10.87 |
0.22 |
7.14 |
0.50 |
5.66 |
0.21 |
16.67 |
0.29 |
5.88 |
0.25 |
Others |
9.31 |
0.33 |
- |
- |
2.17 |
0.11 |
- |
- |
5.66 |
0.21 |
10.00 |
0.28 |
- |
- |
Total preys |
43 |
24 |
46 |
14 |
53 |
30 |
34 |
|||||||
Specimens |
9 |
4 |
9 |
2 |
14 |
7 |
8 |
|||||||
Prey/lizard |
4.78 |
6.00 |
5.11 |
7.00 |
3.79 |
4.29 |
4.25 |
|||||||
Table A8. Diet composition of females Podarcis gaigeae from three mainland (Skyros Island) and four islet populations. %n refers to the percentage of prey items in the stomachs, f refers to the proportion of individuals lizards eaten the prey.
Groups |
D |
DII |
L |
AI |
N |
AF |
PA |
|
||||||||||||||
n% |
f |
n% |
f |
n% |
f |
n% |
f |
n% |
f |
n% |
f |
n% |
f |
|||||||||
Araneae |
2.50 |
0.14 |
7.41 |
0.40 |
5.56 |
0.25 |
4.35 |
0.20 |
13.89 |
0.20 |
4.00 |
0.14 |
11.54 |
0.33 |
|
|||||||
Opilionidia |
- |
- |
3.70 |
0.20 |
- |
- |
8.70 |
0.20 |
5.56 |
0.20 |
8.00 |
0.29 |
3.85 |
0.17 |
|
|||||||
Orthoptera |
12.50 |
0.71 |
3.70 |
0.20 |
2.78 |
0.13 |
8.70 |
0.20 |
5.56 |
0.20 |
4.00 |
0.14 |
- |
- |
|
|||||||
Helicidae |
5.00 |
0.14 |
3.70 |
0.20 |
5.56 |
0.25 |
4.35 |
0.20 |
- |
- |
- |
- |
- |
- |
|
|||||||
Homoptera |
5.00 |
0.14 |
7.41 |
0.40 |
2.78 |
0.13 |
- |
- |
- |
- |
- |
- |
3.85 |
0.17 |
|
|||||||
Hemiptera |
2.50 |
0.14 |
7.41 |
0.40 |
5.56 |
0.13 |
4.35 |
0.20 |
- |
- |
- |
- |
- |
- |
|
|||||||
Heteroptera |
5.00 |
0.29 |
7.41 |
0.40 |
2.78 |
0.13 |
8.70 |
0.20 |
2.78 |
0.10 |
- |
- |
- |
- |
|
|||||||
Diptera |
2.50 |
0.14 |
- |
- |
2.78 |
0.13 |
- |
- |
2.78 |
0.10 |
12.00 |
0.29 |
3.85 |
0.17 |
|
|||||||
Isopoda |
7.50 |
0.29 |
11.11 |
0.40 |
11.11 |
0.38 |
4.35 |
0.20 |
2.78 |
0.10 |
- |
- |
3.85 |
0.17 |
|
|||||||
Dictyoptera |
2.50 |
0.14 |
- |
- |
5.56 |
0.13 |
- |
- |
2.78 |
0.10 |
- |
- |
- |
- |
|
|||||||
Coleoptera |
30.00 |
0.71 |
14.81 |
0.40 |
16.67 |
0.38 |
26.09 |
0.60 |
2.78 |
0.10 |
8.00 |
0.14 |
7.69 |
0.33 |
|
|||||||
Hymenoptera |
5.00 |
0.14 |
11.11 |
0.40 |
16.67 |
0.50 |
8.70 |
0.40 |
2.78 |
0.10 |
12.00 |
0.29 |
19.23 |
0.50 |
|
|||||||
Formicdae |
10.00 |
0.29 |
14.81 |
0.40 |
16.67 |
0.50 |
8.70 |
0.40 |
52.78 |
0.70 |
40.00 |
0.71 |
42.31 |
0.83 |
|
|||||||
Insect larvae |
5.00 |
0.29 |
7.41 |
0.20 |
5.56 |
0.25 |
8.70 |
0.20 |
2.78 |
0.10 |
12.00 |
0.29 |
3.85 |
0.17 |
|
|||||||
Others |
5.00 |
0.29 |
- |
- |
- |
- |
4.35 |
0.20 |
2.78 |
0.10 |
- |
- |
- |
- |
|
|||||||
Total preys |
40 |
27 |
36 |
23 |
36 |
25 |
26 |
|
||||||||||||||
Specimens |
7 |
5 |
8 |
5 |
10 |
7 |
6 |
|
||||||||||||||
Prey/lizard |
5.71 |
5.40 |
4.50 |
4.60 |
3.60 |
3.57 |
4.33 |
|
||||||||||||||
Table A9. Pairwise comparison of chi-squared test (Fisher exact) of the most common prey items consumed between habitats (below diagonal). Shannon diversity t test (above diagonal). Bold, italicized values indicate significant differences. The population abbreviations correspond to these in Fig. 1A, main manuscript. Blue squares are islet-islet comparisons, yellow squares are islet-main island comparisons and green squares are main island – main island comparisons.
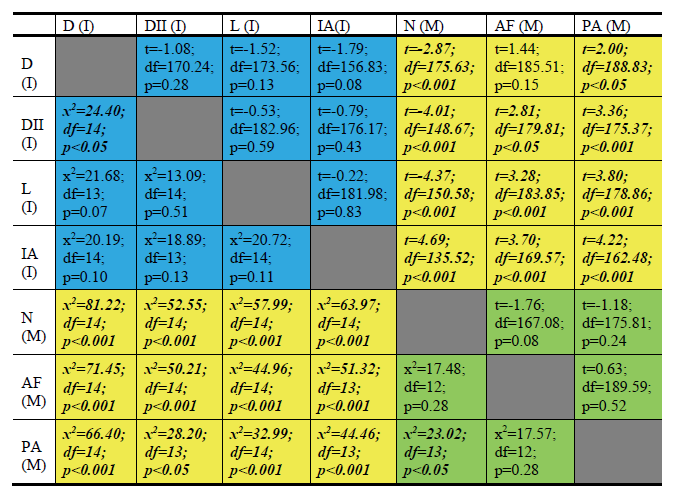
Table A10. Pairwise comparison of food niche overlap (Pianka's index; Qjk) between lizard populations according to the percentage of relative abundance (%n). The population abbreviations correspond to these in Fig. 1A, main manuscript. Islets are denoted by (I) and main island localities with (M). Blue squares are islet-islet comparisons, yellow squares are islet-main island comparisons and green squares are main island – main island comparisons.
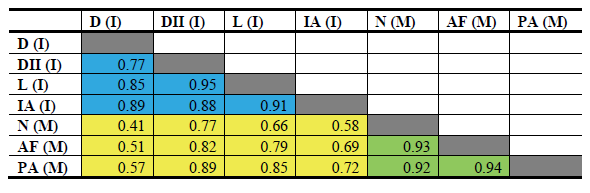
Table A11. Mean consumed prey volume (mm3) based on intact parts of insects for the five most common categories. Means ± standard error and sample size (N).
Groups |
D |
DII |
L |
IA |
N |
AF |
PA |
Coleoptera |
14.13 ± 6.50 (N = 12) |
8.25 ± 4.32 (N = 3) |
10.83 ± 4.44 (N = 6) |
5.14 ± 3.59 (N = 4) |
1.55 ± 0.00 (N = 1) |
37.22 ± 0.00 (N = 1) |
19.39 ± 17.83 (N = 2) |
Formicidae |
2.58 ± 1.19 (N = 4) |
2.87 ± 1.78 (N = 5) |
1.86 ± 0.73 (N = 7) |
3.90 ± 1.78 (N = 3) |
3.15 ± 0.73 (N = 15) |
0.61 ± 0.26 (N = 9) |
2.61 ± 0.77 (N = 8) |
Hymenoptera |
3.37 ± 3.16 (N = 2) |
5.74 ± 3.97 (N = 2) |
1.83 ± 0.95 (N = 4) |
– |
19.07 ± 14.41 (N = 2) |
2.75 ± 0.76 (N = 3) |
2.23 ± 1.00 (N = 5) |
Isopoda |
1.98 ± 0.64 (N = 3) |
10.19 ± 3.78 (N = 3) |
31.73 ± 23.65 (N = 3) |
2.62 ± 0.00 (N = 1) |
2.62 ± 0.00 (N = 2) |
– |
2.62 ± 0.00 (N = 1) |
Orthoptera |
10.15 ± 0.50 (N = 4) |
10.09 ± 0.0 (N = 1) |
10.09 ± 0.0 (N = 1) |
10.14 ± 0.0 (N = 2) |
10.11 ± 0.03 (N = 2) |
– |
– |
Mean prey size |
9.32 ± 3.25 (N = 25) |
7.14 ± 1.83 (N = 14) |
9.08 ± 3.81 (N = 21) |
5.52 ± 1.61 (N = 10) |
5.11 ± 1.51 (N = 22) |
4.90 ± 2.75 (N = 13) |
4.59 ± 2.23 (N = 16) |
Total preys found in faeces |
83 |
51 |
82 |
37 |
89 |
55 |
60 |
Fecal pellets (lizards) |
16 |
9 |
17 |
7 |
24 |
14 |
14 |
Table A12. Pairwise comparison of chi-squared test (Fisher exact) of the most common available prey items between habitats (below diagonal). Shannon diversity t test (above diagonal). Bold, italicized values indicate significant differences. The population abbreviations correspond to these in Fig. 1A, main manuscript. Islets are denoted by (I) and main island localities with (M). Blue squares are islet-islet comparisons, yellow squares are islet-main island comparisons and green squares are main island – main island comparisons.
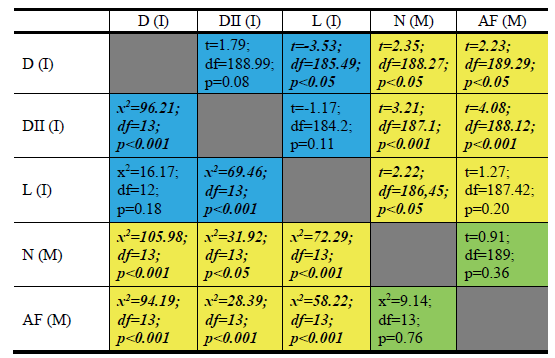
Table A13. Electivity values (D, Jacobs' index) based on to the percentage of relative abundance (%n) of the most common prey types available at each locality that are found in the faeces of each Podarcis gaigeae population.
Mainland populations |
|
Islet populations |
|||||||
Group |
N |
AF |
|
D |
DII |
L |
|||
Jacobs’ D |
|||||||||
Coleoptera |
-0.43 |
-0.07 |
|
-0.09 |
0.48 |
-0.03 |
|||
Formicdae |
0.16 |
-0.16 |
|
-0.71 |
-0.05 |
-0.29 |
|||
Hymenoptera |
-0.06 |
0.34 |
|
0.35 |
0.91 |
0.80 |
|||
Araneae |
0.56 |
-0.24 |
|
0.03 |
0.08 |
0.25 |
|||
Isopoda |
0.40 |
-1.00 |
|
0.83 |
-0.88 |
-0.64 |
|||
Heteroptera |
0.58 |
-1.00 |
|
0.98 |
0.55 |
0.62 |
|||
Homoptera |
-1.00 |
0.86 |
|
0.99 |
0.96 |
0.85 |
|||
Orthoptera |
0.99 |
0.94 |
|
0.96 |
0.99 |
0.50 |
|||
Helicidae |
-1.00 |
-1.00 |
|
0.95 |
0.84 |
-0.18 |
|||
Opilionidia |
0.26 |
0.93 |
|
0.99 |
− |
− |
|||
Diptera |
-0.87 |
-0.56 |
|
-1.00 |
0.22 |
-0.42 |
|||
Larvae |
0.90 |
1.00 |
|
0.93 |
0.94 |
0.52 |
|||
Others |
0.25 |
0.06 |
|
0.28 |
0.56 |
0.38 |
|||
Linear Food Selection Index |
|||||||||
Coleoptera |
-0.06 -0.06/-0.06 |
-0.01 -0.02/0.00 |
|
-0.01 -0.03/0.01 |
0.17 0.15/0.18 |
-0.01 -0.02/0.01 |
|||
Formicdae |
-0.01 -0.01/0.00 |
0.05 0.04/0.06 |
|
0.10 0.09/0.10 |
0.00 0.00/0.00 |
0.11 0.10/0.11 |
|||
Hymenoptera |
0.08 0.07/0.09 |
-0.08 -0.11/-0.05 |
|
0.10 0.07/0.12 |
-0.51 -0.52/-0.50 |
-0.10 -0.12/-0.08 |
|||
Araneae |
0.07 0.07/0.07 |
-0.03 -0.04/-0.02 |
|
0.05 0.04/0.06 |
-0.04 -0.04/-0.03 |
0.03 0.02/0.03 |
|||
Isopoda |
0.01 0.01/0.01 |
-0.04 -0.04/-0.04 |
|
-0.56 -0.59/-0.53 |
0.09 0.09/0.09 |
-0.19 -0.21/-0.18 |
|||
Heteroptera |
-0.23 -0.23/-0.22 |
-0.14 -0.16/-0.13 |
|
-0.01 -0.01/-0.01 |
-0.03 -0.03/-0.02 |
-0.03 -0.04/-0.03 |
|||
Homoptera |
0.01 0.01/0.01 |
0.00 0.00/0.00 |
|
0.06 0.05/0.06 |
0.07 0.07/0.07 |
0.03 0.03/0.03 |
|||
Orthoptera |
-0.01 -0.01/-0.01 |
-0.02 -0.02/-0.02 |
|
0.02 0.01/0.02 |
0.04 0.03/0.04 |
-0.02 -0.02/-0.01 |
|||
Helicidae |
0.00 0.00/0.00 |
0.03 0.03/0.04 |
|
0.08 0.07/0.08 |
0.04 0.03/0.04 |
0.06 0.05/0.06 |
|||
Opilionidia |
0.04 0.04/0.04 |
0.15 0.14/0.15 |
|
0.06 0.05/0.06 |
0.03 0.03/0.03 |
0.06 0.05/0.06 |
|||
Diptera |
0.02 0.02/0.02 |
0.03 0.03/0.04 |
|
0.04 0.04/0.04 |
0.00 0.00/0.00 |
0.00 0.00/0.00 |
|||
Larvae |
0.03 0.03/0.03 |
0.05 0.05/0.05 |
|
0.04 0.04/0.04 |
0.10 0.09/0.10 |
0.03 0.03/0.03 |
|||
Others |
0.00 0.00/0.00 |
0.00 0.00/0.00 |
|
-0.01 -0.01/-0.01 |
0.02 0.02/0.02 |
0.00 0.00/0.00 |
|||
Table A14. Dietary divergence between females. Pairwise t test comparison of Shannon diversity index among female populations. Bold, italicized values indicate significant differences; as 21 pairwise tests were performed we apply a Bonferroni corrected value of significance of 0.0024). The population abbreviations correspond to these in Fig. 1A, main manuscript. Islets are denoted by (I) and main island localities with (M). Blue squares are islet-islet comparisons, yellow squares are islet-main island comparisons and green squares are main island – main island comparisons.
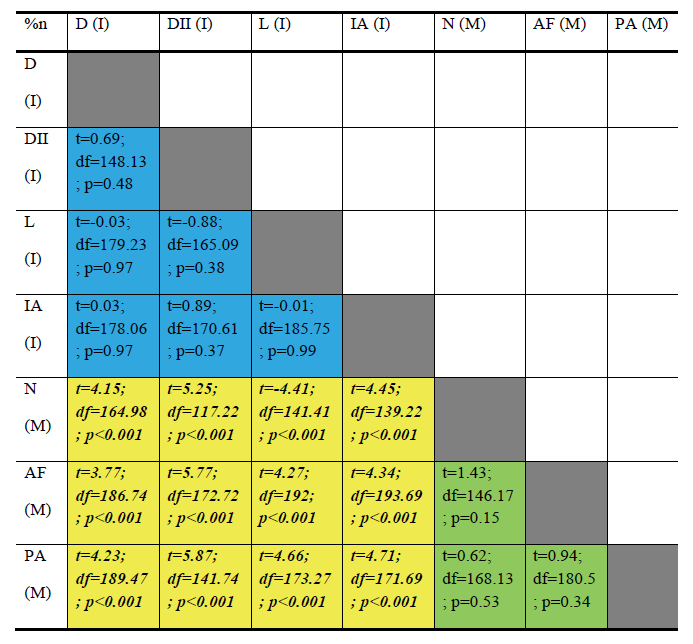
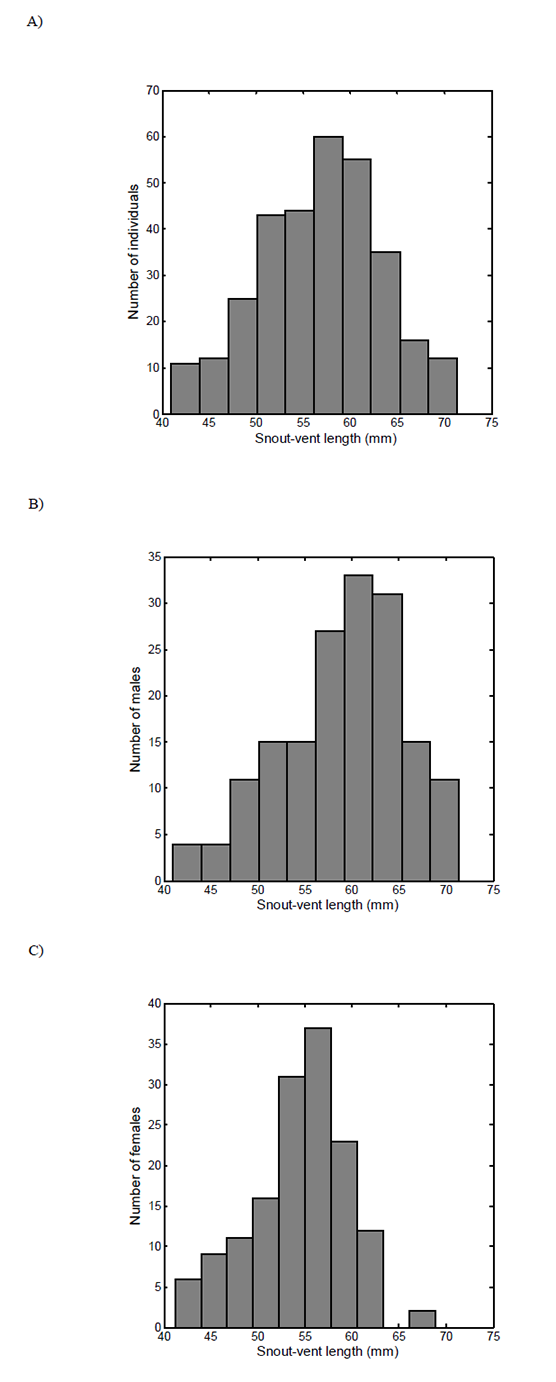
Fig. A6. Size distributions for mainland lizards based on snout-vent length. If a fraction of juveniles would be present among the mainland individuals and contribute to the size differences between islet- and mainland individuals, a bimodal size distribution on the mainland would be expected. This is not the case neither for (A) all mainland individuals, (B) males only or (C) females only.