Ecological Archives E096-183-A3
Jeffrey P. Stephens, Keith A. Berven, Scott D. Tiegs, and Thomas R. Raffel. 2015. Ecological stoichiometry quantitatively predicts responses of tadpoles to a food quality gradient. Ecology 96:20702076. http://dx.doi.org/10.1890/14-2439.1
Appendix C. Supplemental tables and figures presenting: leaf litter composition measurements, model parameters and variables, model optimization results, generalized linear model results, sensitivity analysis, sources of algal C and N values, treatment effects on amphibian traits, and gut contents analysis results.
Table C1. Chemistry of each litter mixture used in the experiment. Mixture C:N was calculated by dividing total C by total N. Molar amounts of C and N were used for modeling purposes.
Mixture |
Mixture Chemistry |
|||||
% Fraxinus |
% Acer |
|
C |
N |
C:N |
molar C:N |
0 |
100 |
52.13 |
0.43 |
120.12 |
140.20 |
|
25 |
75 |
50.61 |
0.79 |
64.23 |
74.97 |
|
50 |
50 |
49.09 |
1.14 |
42.99 |
50.17 |
|
75 |
25 |
47.57 |
1.50 |
31.80 |
37.12 |
|
100 |
0 |
46.05 |
1.85 |
24.89 |
29.05 |
|
Table C2. Parameters and variables used in the tadpole growth model.
Model Parameter |
|
Meaning |
Units |
Value |
Source |
QC |
Concentration of carbon bound in consumer mass |
mmol C ∙ mg-1 tadpole dry mass |
3.75 × 10⁻²a 3.06 × 10⁻²b |
Stephens et al. 2013 |
|
QN |
Concentration of nitrogen bound in consumer mass |
mmol N ∙ mg-1 tadpole dry mass |
7.99 × 10⁻³a 4.78 × 10⁻³b |
Stephens et al. 2013 |
|
SN |
Nitrogen Assimilation Efficiency; the percent of nitrogen that passes the gut lumen relative to the amount consumed |
Dimensionless fraction from one to zero |
1.00 |
Sterner and Elser 2002 |
|
LN |
Minimal loss rate of nitrogen |
mmol N lost ∙ mmol N tadpole-1 ∙ day-1 |
1.25 × 10⁻²a 2.19 × x10-2b |
Munro 1952 |
|
I |
|
Food intake rate |
mg food ∙ mg-1 tadpole ∙ day-1 |
0.79a 0.84b |
Richardson 2002 |
Model Variable |
|
|
|
|
|
AC |
Concentration of carbon bound in food mass |
mmol C ∙ mg-1 leaf litter dry mass |
Variable |
Measured |
|
AN |
Concentration of nitrogen bound in food mass |
mmol N ∙ mg-1 leaf litter dry mass |
Variable |
Measured |
|
gC |
Specific rate of tadpole growth based on carbon |
mmol C ∙ mg-1 tadpole dry mass ∙ day-1 |
Variable |
Measured & calculated |
|
|
|
|
|
|
|
a = Wood frog values, b = American toad values |
|||||
Table C3. Results of model optimization for growth rates of wood frogs in low light, using the “nls” function in Program R. Parameters whose values were obtained from the literature were not included as degrees of freedom in AIC calculations.
Model |
I value |
LN value |
AIC |
Literature |
0.79 |
0.0125 |
-494.48 |
I optimized |
0.78 |
0.0125 |
-494.52 |
LN optimized |
0.79 |
0.0142 |
-494.68 |
I and LN optimized |
0.85 |
0.0214 |
-494.98 |
Table C4. Results of the general linear models conducted on amphibian traits. Type II sums of squares were used for this analysis.
Trait |
Predictors |
Coef. |
|
Statistic |
|
P |
||
Mass |
Nitrogen |
-69.67 |
F1,66 |
= |
0.42 |
0.518 |
||
Nitrogen2 a |
121.01 |
F1,66 |
= |
6.88 |
0.011 |
|||
Light |
5.25 |
F1,66 |
= |
0.16 |
0.695 |
|||
Amphibian |
-244.49 |
F1,66 |
= |
154.83 |
<0.001 |
|||
Block |
11.53 |
F1,66 |
= |
3.73 |
0.058 |
|||
Nitrogen*Light |
8.20 |
F1,66 |
= |
0.09 |
0.763 |
|||
Nitrogen*Amphibian |
-28.76 |
F1,66 |
= |
78.39 |
<0.001 |
|||
Light*Amphibian |
-28.76 |
F1,66 |
= |
1.15 |
0.288 |
|||
|
Nitrogen*Light*Amphibian |
-72.81 |
|
F1,66 |
= |
1.83 |
|
0.181 |
Larval Period |
Nitrogen |
-11.53 |
F1,67 |
= |
61.66 |
<0.001 |
||
Light |
-8.20 |
F1,67 |
= |
46.92 |
<0.001 |
|||
Amphibian |
-18.30 |
F1,67 |
= |
155.38 |
<0.001 |
|||
Block |
1.49 |
F1,67 |
= |
5.67 |
0.020 |
|||
Nitrogen*Light |
1.46 |
F1,67 |
= |
0.38 |
0.540 |
|||
Nitrogen*Amphibian |
14.71 |
F1,67 |
= |
38.56 |
<0.001 |
|||
Light*Amphibian |
-4.69 |
F1,67 |
= |
3.96 |
0.050 |
|||
|
Nitrogen*Light*Amphibian |
4.51 |
|
F1,67 |
= |
0.90 |
|
0.345 |
Survival |
Nitrogen |
14.00 |
F1,67 |
= |
55.23 |
<0.001 |
||
Light |
2.99 |
F1,67 |
= |
2.19 |
0.144 |
|||
Amphibian |
1.81 |
F1,67 |
= |
0.74 |
0.391 |
|||
Block |
0.40 |
F1,67 |
= |
0.23 |
0.635 |
|||
Nitrogen*Light |
3.34 |
F1,67 |
= |
0.87 |
0.353 |
|||
Nitrogen*Amphibian |
-10.87 |
F1,67 |
= |
9.23 |
0.003 |
|||
Light*Amphibian |
16.82 |
F1,67 |
= |
22.37 |
<0.001 |
|||
Nitrogen*Light*Amphibian |
-8.03 |
F1,67 |
= |
1.26 |
0.266 |
|||
a Represents the polynomial term used in the general linear models conducted for mass at metamorphosis.
Table C5. Sensitivity analysis of the optimized parameters. We chose to conduct this analysis using an AN and AC of 1.26 × 10⁻³ and 3.86 × 10⁻² respectively yielding a C:N of 30.6. Each parameter was then independently increased or decreased by 20% and the resulting growth rate was then compared to the original.
Parameter |
Starting parameter value |
Initial gc |
% change in gc after ± 20% change in parameter |
I |
0.79 |
0.00421 |
22.23% |
LN |
0.0125 |
0.00421 |
2.23% |
AN |
1.26x10⁻³ |
0.00421 |
22.23% |
Table C6. Literature sources of C and N values for periphyton dry mass used in the meta-analysis, indicating the number of values taken from each source.
Source |
Journal |
|
Number of |
||
Bowman et al. 2005 |
Freshwater Biology |
9 |
|||
Rothlisberger et al. 2008 |
JNABS |
4 |
|||
Stelzer and Lamberti 2002 |
Ecology |
4 |
|||
Frost et al. 2007 |
Freshwater Biology |
16 |
|||
Drake et al. 2012 |
Limnology |
20 |
|||
Evans-White and Lamberti 2005 |
Freshwater Biology |
3 |
|||
Evans-White and Lamberti 2006 |
Ecology Letters |
12 |
|
|
|
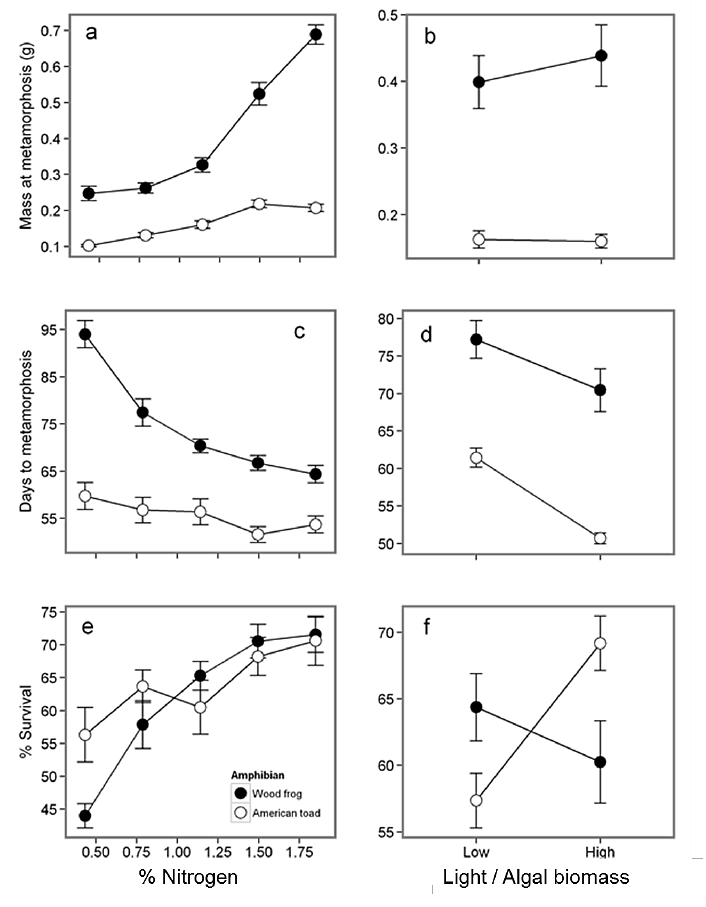
Fig. C1. Mixture N and light alter amphibian traits: (a,b) mass at metamorphosis, (c,d) larval period, and (e,f) larval survival. Open and closed circles represent wood frogs and American toads respectively. Each point represents the treatment mean ± 1 SE. Results of general linear models are given in Table C4.
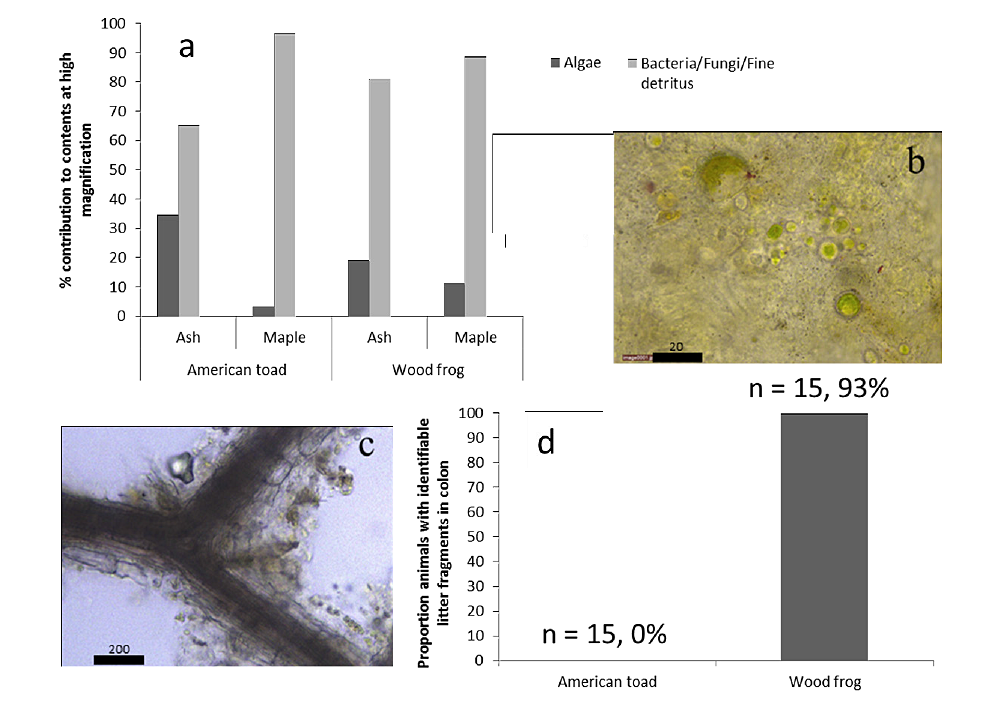
Fig. C2. Results of colon contents analysis. One new metamorph was randomly selected from each of the 100% ash and 100% maple mesocosm at both high and low light. Colons were then dissected and emptied for gut content screening. Contents were spread evenly on a microscope slide. We estimated the proportion of a representative field of view at 400x magnification that contained algae or bacteria/fungi/fine detritus (a). Toad colon contents (b) contained algal and biofilm detritus (green in color) with no signs of leaf fragments. We also recorded whether or not leaf litter fragments (c) were present in the colon contents of each animal (d) Wood frog colons contained coarser detritus composed of leaf vasculature (c), in addition to algae and bacterial detritus.
Literature cited
Bowman, M. F., P. A. Chambers, and D. W. Schindler. 2005. Changes in stoichiometric constraints on epilithon and benthic macroinvertebrates in response to slight nutrient enrichment of mountain rivers. Freshwater Biology 50:1836–1852.
Drake, W., J. T. Scott, M. Evans-White, B. Haggard, A. Sharpley, C. W. Rogers, and E. M. Grantz. 2012. The effect of periphyton stoichiometry and light on biological phosphorus immobilization and release in streams. Limnology 13:97–106.
Evans‐White, M. A., and G. A. Lamberti. 2006. Stoichiometry of consumer‐driven nutrient recycling across nutrient regimes in streams. Ecology Letters 9:1186–1197.
Evans-White, M. A., R. S. Stelzer, and G. A. Lamberti. 2005. Taxonomic and regional patterns in benthic macroinvertebrate elemental composition in streams. Freshwater Biology 50:1786–1799.
Frost, P. C., C. T. Cherrier, J. H. Larson, S. Bridgham, and G. A. Lamberti. 2007. Effects of dissolved organic matter and ultraviolet radiation on the accrual, stoichiometry and algal taxonomy of stream periphyton. Freshwater Biology 52:319–330.
Munro, A. F. 1953. The ammonia and urea excretion of different species of Amphibia during their development and metamorphosis. The Biochemical journal 54:29–36.
Richardson, J. M. 2002. A comparative study of phenotypic traits related to resource utilization in anuran communities. Evolutionary Ecology 16:101–122.
Rothlisberger, J. D., M. A. Baker, and P. C. Frost. 2008. Effects of periphyton stoichiometry on mayfly excretion rates and nutrient ratios. Journal of the North American Benthological Society 27:497–508.
Stelzer, R. S., and G. A. Lamberti. 2002. Ecological stoichiometry in running waters: periphyton chemical composition and snail growth. Ecology 83:1039–1051.
Stephens, J. P., K. A. Berven, and S. D. Tiegs. 2013. Anthropogenic changes to litter input affect the fitness of a larval amphibian. Freshwater Biology 58:1631–1646.
Sterner, R. W., and J. J. Elser. 2002. Ecological stoichiometry: the biology of elements from molecules to the biosphere. Princeton University Press, Princeton, New Jersey, USA.
Vanni, M. J. 2002. Nutrient cycling by animals in freshwater ecosystems. Annual Review of Ecology and Systematics :341–370.