Ecological Archives E096-182-A2
Zaal Kikvidze, Robin W. Brooker, Bradley J. Butterfield, Ragan M. Callaway, Lohengrin A. Cavieres, Bradley J. Cook, Christopher J. Lortie, Richard Michalet, Francisco I. Pugnaire, Sa Xiao, Fabien Anthelme, Robert G. Björk, Brittany H. Cranston, Rosario G. Gavilán, Róbert Kanka, Emanuele Lingua, Jean-Paul Maalouf, Jalil Noroozi, Rabindra Parajuli, Gareth K. Phoenix, Anya Reid, Wendy M. Ridenour, Christian Rixen, and Christian Schöb. 2015. The effects of foundation species on community assembly: a global study on alpine cushion plant communities. Ecology 96:2064–2069. http://dx.doi.org/10.1890/14-2443.1
Appendix B. Measuring β-diversity.
Measuring β-diversity
We used two other indices in addition to Sørensen’s multi-site dissimilarity index (hereafter Sørensen’s index) in the analyses of β-diversity; these two indices are Raup-Crick dissimilarity index (hereafter Raup-Crick index) and β deviation. Although Sørensen’s index is reported in the main text, here we show it again to facilitate comparisons between the indices.
Raup-Crick index uses presence/absence data and shows the degree to which the null-expected number of shared species among assemblages deviates from the observed number of shared species, thereby controlling for the effects of α-diversity on β-diversity (Chase et al. 2011). The degree of deviation is given as the probability of sharing no identical species, and ranges between 0 (low dissimilarity) and 1 (high dissimilarity).
β deviation employs null-models and measures compositional dissimilarity using individual numbers of species to control the effects of the species pool on β-diversity (Kraft et al. 2011). It is inversely related to β-diversity and can take any value including negative signs – this makes comparisons with other indices complicated. For easier comparisons, we used the following transformation: 1-(xi-xmin)/(xmax-xmin), where xi, xmax and xmin are the ith, maximum and minimum values of the index, respectively. Hereafter we refer to this transformed index as β deviation. It changes within the range 0 and 1, with the values close to 0 indicating no or very low β-diversity and, vice versa, the values close to 1 indicating high β-diversity.
Non-parametric paired tests (Wilcoxon signed rank test) were used to test for differences in β-diversity indices between the microhabitats (cushion versus open). Calculation of indices was performed in the R environment with the software packages base (R Development Core Team 2011) and vegan (Oksanen et al. 2011).
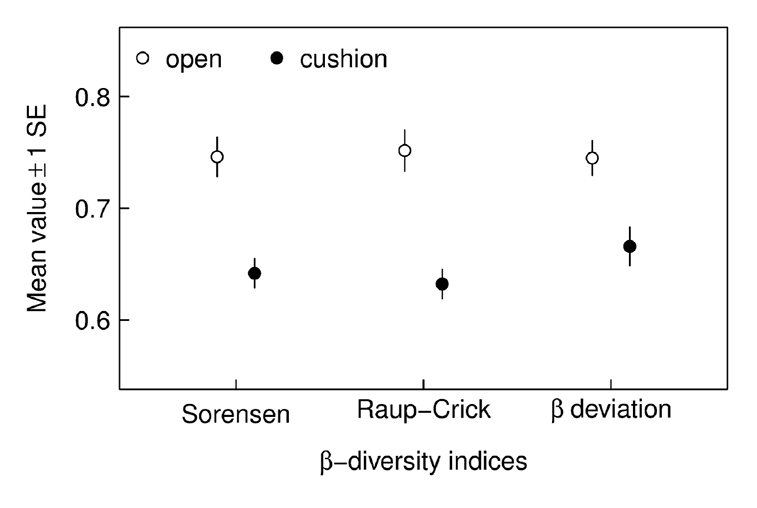
All three indices that we used in this study showed c.1.2 times reduced levels of β-diversity in the cushions than in the open area plots (Fig. B1). This difference most probably results from the overall facilitative effect of cushions outweighing their heterogeneity effect on cushion-associated species assemblages.
Fig. B1. The difference in the mean values of β-diversity indices between the cushions and the open microhabitat plots; the mean values of all β-diversity indices were lower in cushions than in open microhabitats across sites globally, and all the differences were highly significant (P < 0.0001).
Literature Cited
Chase, J., N. J. B. Kraft, K. G. Smith, M. Vellend, and B. D. Inouye. 2011. Using null model to disentangle variation in community dissimilarity from variation in α-diversity. Ecosphere 2:24.
Kraft, N. J. B., L. S. Comita, J. M. Chase, N. J. Sanders, N. G. Swenson, et al. 2011. Disentangling the drivers of diversity along latitudinal and elevational gradients. Science 333:1755–1758.