Ecological Archives E096-177-A1
Lloyd S. Peck, Michael A. S. Thorne, Joseph I. Hoffman, Simon A. Morley, and Melody S. Clark. 2015. Variability among individuals is generated at the gene expression level. Ecology 96:17141724. http://dx.doi.org/10.1890/14-0726.1
Appendix A. Primer combinations for AFLP analysis; Variance inflation factors for L. elliptica and N. concinna metrics; STRUCTURE programme output for Bayesian analyses; gene expression frequency distributions; and raw data figures for oxygen consumption, activity, gene expression, shell dimensions and mass measures of L. elliptica and N. concinna.
Table A1. Primer combinations used for AFLP genotyping and numbers of AFLP loci generated in N. concinna and L. elliptica (n = 48 and 45 individuals respectively).
TaqI primer (5'-3') |
EcoRI primer (5'-3') |
N. concinna |
L. elliptica |
||||
|
|
No. loci |
No. polymorphic loci |
% polymorphic loci |
No. loci |
No. polymorphic loci |
% polymorphic loci |
GATGAGTCCTGACCGA–CTG |
GACTGCGTACCAATTC–AGC |
32 |
25 |
78.1 |
15 |
11 |
73.3 |
GATGAGTCCTGACCGA–CGA |
GACTGCGTACCAATTC–AGC |
27 |
18 |
66.7 |
14 |
11 |
78.6 |
GATGAGTCCTGACCGA–CAG |
GACTGCGTACCAATTC–AGC |
8 |
5 |
62.5 |
16 |
11 |
68.8 |
GATGAGTCCTGACCGA–CAC |
GACTGCGTACCAATTC–AGC |
27 |
20 |
74.1 |
14 |
13 |
92.9 |
GATGAGTCCTGACCGA–CCA |
GACTGCGTACCAATTC–AAC |
34 |
27 |
79.4 |
– |
– |
– |
GATGAGTCCTGACCGA–CCA |
GACTGCGTACCAATTC–ACA |
33 |
30 |
90.9 |
24 |
17 |
70.8 |
GATGAGTCCTGACCGA–CAC |
GACTGCGTACCAATTC–ATG |
41 |
35 |
85.4 |
– |
|
– |
GATGAGTCCTGACCGA–CTG |
GACTGCGTACCAATTC–ATG |
– |
– |
– |
9 |
7 |
77.8 |
Total |
|
202 |
160 |
79.2 |
92 |
70 |
76.1 |
Table A2. Variance Inflation Factors showing the level of colinearity in the measures taken for Laternula elliptica. There are two separate sets as those organisms which were tested for HSP expression were different from the set tested for upper lethal temperature. Type refers to metric type (gene expression (G); physiological (P); morphological (M)). )). The largest measures were removed in subsequent analyses until all remaining values were less than 10.
Measure (for animals in HSP expression trials) |
VIF |
VIF excluding Tissue dry mass |
Type of measure |
ManHSP70A |
11.23 |
7.69 |
G |
ManHSP70B |
12.16 |
7.42 |
G |
SiphHSP70A |
2.45 |
2.11 |
G |
SiphHSP70B |
2.39 |
2.07 |
G |
Whole animal O2 Consumption |
2.46 |
1.99 |
P |
Burial duration |
1.61 |
1.52 |
P |
Age |
2.13 |
1.87 |
M |
Animal |
3.13 |
2.80 |
M |
Tissue dry mass |
75.77 |
|
M |
Tissue AFDM |
59.55 |
3.87 |
M |
Shell dry mass |
4.86 |
4.47 |
M |
Shell length |
2.48 |
2.36 |
M |
Measure ( for animals used in UTL trials) |
|
|
|
While animal O2 Consumption |
1.63 |
1.61 |
P |
Burial duration |
1.50 |
1.75 |
P |
UTL |
1.29 |
1.22 |
P |
Tissue dry mass |
289.90 |
|
M |
Tissue AFDM |
253.01 |
4.51 |
M |
Shell dry mass |
6.27 |
5.27 |
M |
Shell length |
1.45 |
1.43 |
M |
Table A3. Variance Inflation Factors showing the level of colinearity in the measures taken for Nacella concinna. There are two separate sets as those organisms which were tested for HSP expression were different from the set tested for upper lethal temperature. Type refers to metric type (gene expression (G); physiological (P); morphological (M)). )). The largest measures were removed in subsequent analyses until all remaining values were less than 10.
Measure (for animals used in HSP expression trials) |
VIF |
Values after removal of Tissue dry mass |
Values after removal of shell length |
Type |
HSP70B |
1.41 |
1.41 |
1.37 |
G |
Whole animal O2 Consumption |
2.71 |
2.06 |
2.06 |
P |
Tenacity |
2.63 |
2.45 |
2.26 |
P |
Shell length |
12.91 |
11.77 |
|
M |
Shell width |
7.90 |
7.87 |
5.61 |
M |
Shell height |
3.10 |
2.86 |
2.68 |
M |
Tissue dry mass |
201.70 |
|
|
|
Tissue AFDM |
141.69 |
10.75 |
8.73 |
M |
Shell dry mass |
5.82 |
5.39 |
5.31 |
M |
Measure (for animals used in UTL expression trials) |
|
|
|
|
Whole animal O2 Consumption |
1.79 |
1.74 |
1.64 |
P |
Tenacity |
2.15 |
2.12 |
2.10 |
P |
UTL |
3.13 |
2.56 |
1.81 |
P |
Shell length |
17.21 |
11.83 |
4.78 |
M |
Shell width |
13.15 |
12.75 |
|
M |
Shell height |
2.74 |
2.47 |
2.38 |
M |
Foot area |
3.91 |
3.70 |
3.69 |
M |
Tissue dry mass |
212.92 |
|
|
M |
Tissue AFDM |
179.24 |
7.33 |
7.32 |
M |
Shell dry mass |
8.28 |
6.08 |
4.73 |
M |
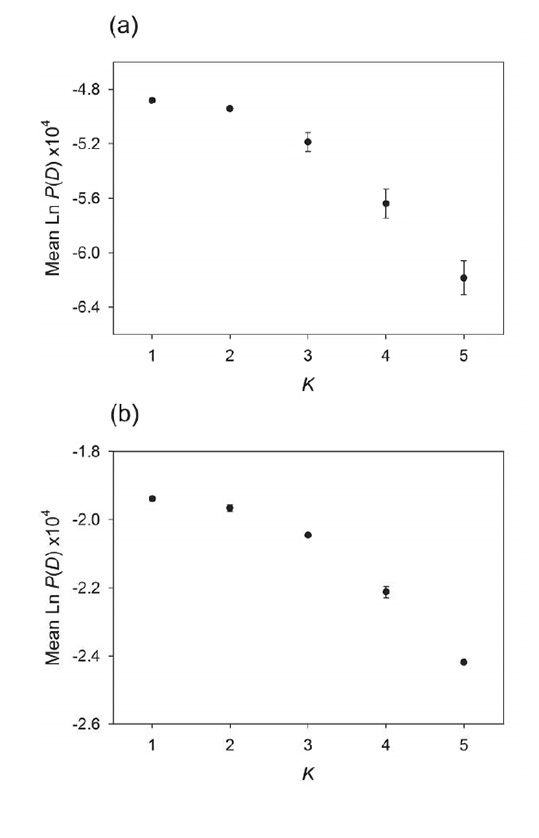
Fig. A1. Results of Bayesian analyses of population structure, implemented in the program STRUCTURE (Pritchard et al. 2000). For each species, the estimated log probability of the data, denoted Ln P(D), was calculated for each value of K, the hypothesised number of distinct genetic clusters, allowing estimation of the most likely number of populations (see Methods for details). Mean ± SE Ln P(D) values based on five replicates for each value of K are presented for (a) N. concinna and (b) L. elliptica. For both species, Ln P(D) peaked at K = 1, indicating support for a single population (i.e. a lack of cryptic population substructure).
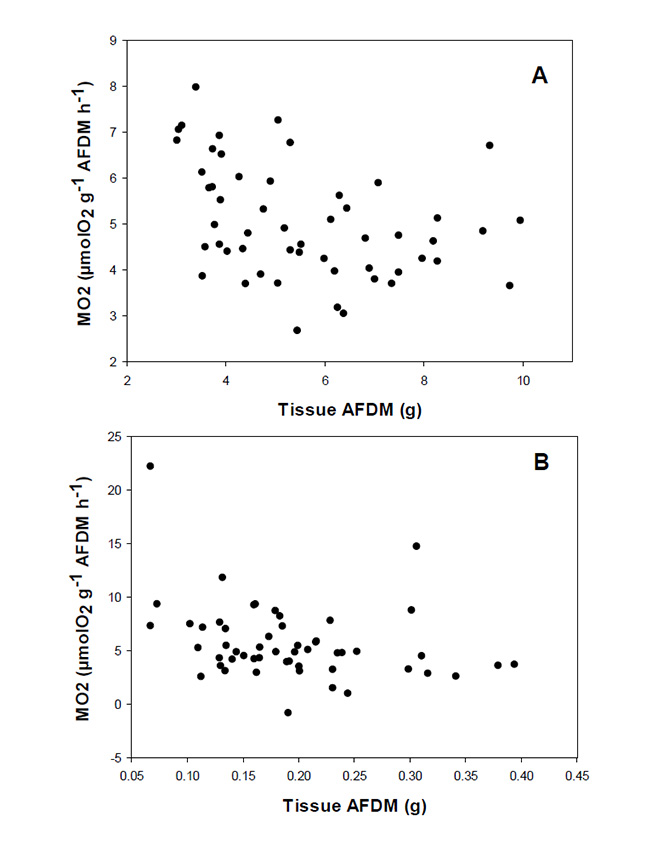
Fig. A2. Respiration rate (oxygen consumed, µmol O2 g-1 AFDM h-1 vs tissue AFDM, g) of A. Laternula elliptica, and B. Nacella concinna. Each data point represents the value for an individual.
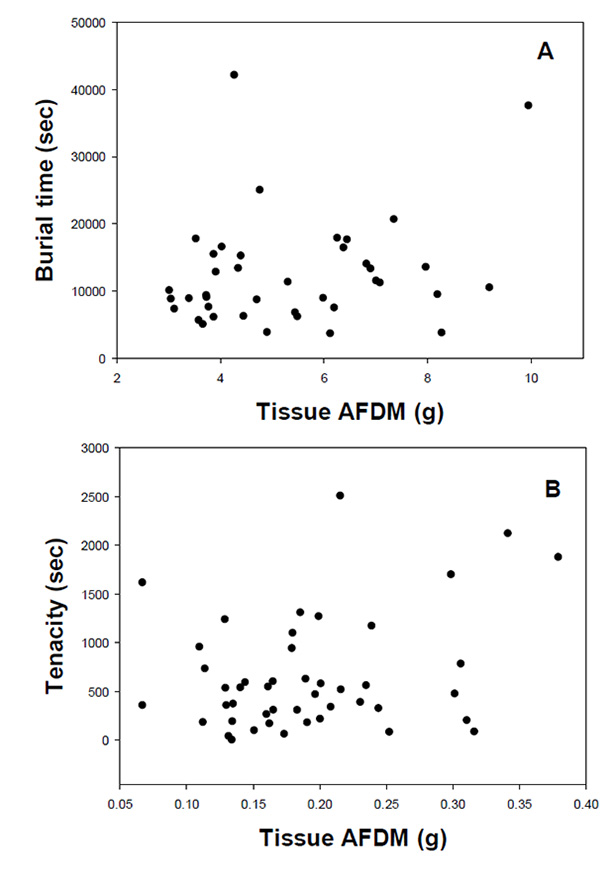
Fig. A3. Activity plots, assessed as burial duration (sec) vs tissue AFDM (g) for Laternula elliptica and tenacity (sec) vs tissue AFDM (g) for Nacella concinna. Each data point represents the value for an individual.
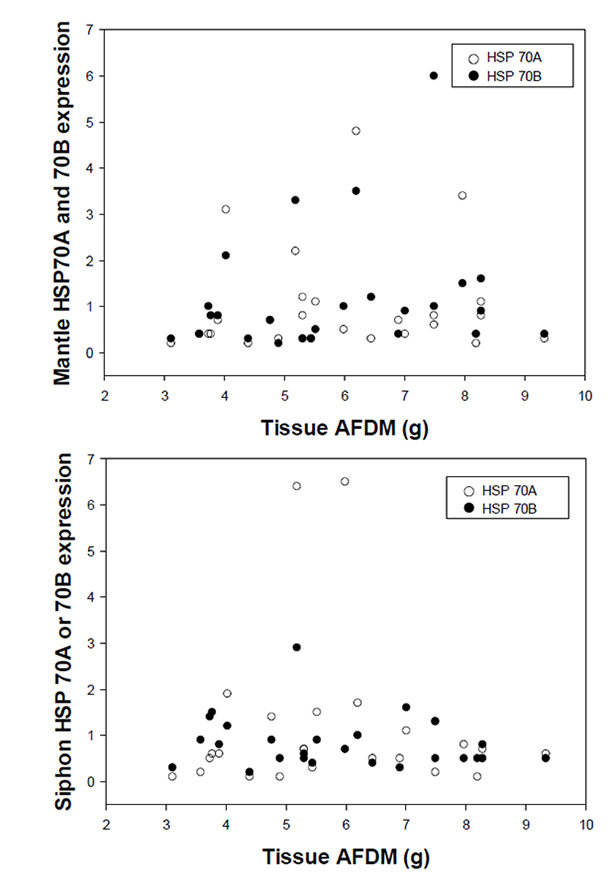
Fig. A4. Gene expression plots for Laternula elliptica. Data presented are HSP70A and 70B expression for mantle (upper) and siphon (lower). Each data point represents the value for an individual.
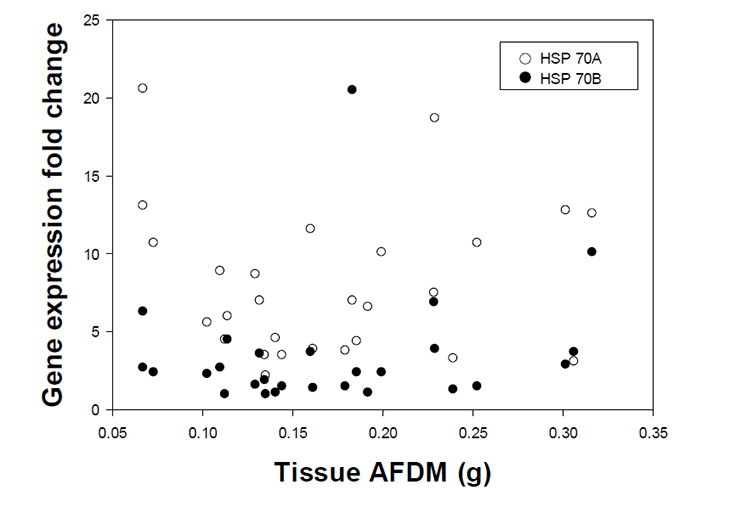
Fig. A5. Gene expression plot for Nacella concinna. Data presented are HSP70A and 70B expression for foot tissue. Each data point represents the value for an individual.
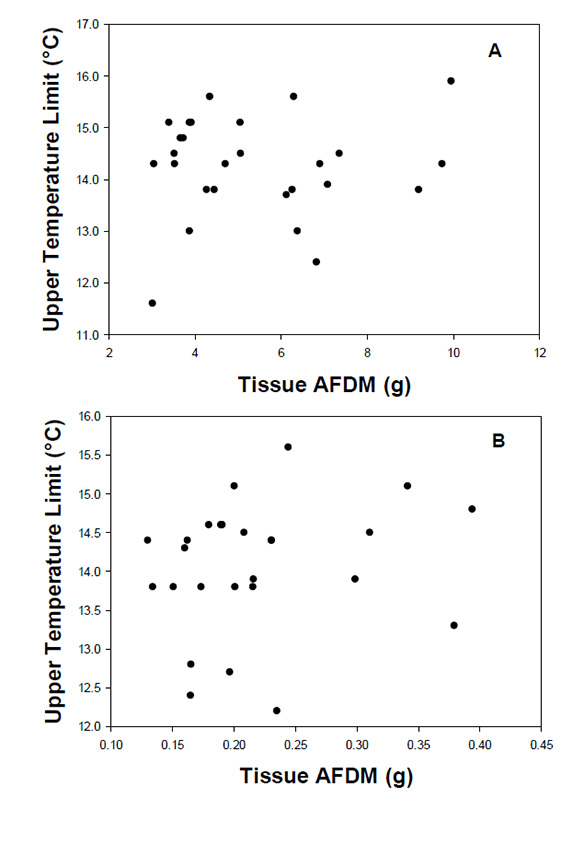
Fig. A6. Upper Temperature Limit (UTL) values plotted vs tissue AFDM for A. Laternula elliptica, and B. Nacella concinna. Each data point represents the value for an individual and indicates the temperature where that individual became unresponsive to external stimuli.
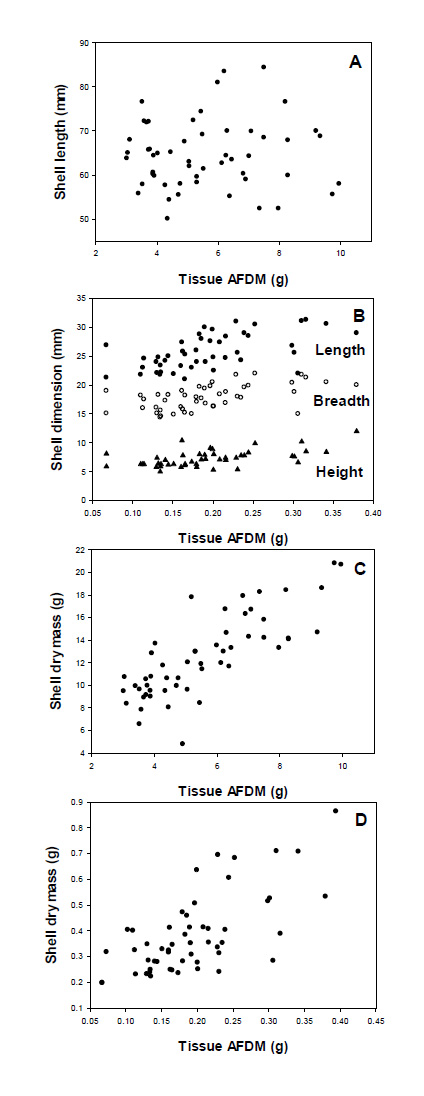
Fig. A7. Shell dimension and shell mass values plotted vs tissue AFDM for A. Laternula elliptica (length, mm), B. Nacella concinna (length, breadth, height, mm). Each data point represents the value for an individual, C. Laternula elliptica (shell dry mass, g) and D. Nacella concinna (shell dry mass, g). Each data point represents the value for an individual.
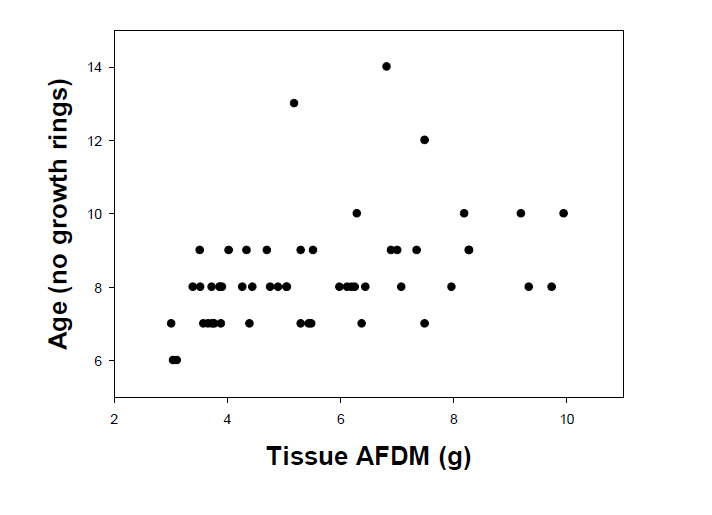
Fig. A8. Age, as number of growth rings on the shell plotted vs tissue AFDM for Laternula elliptica. Each data point represents the value for an individual.
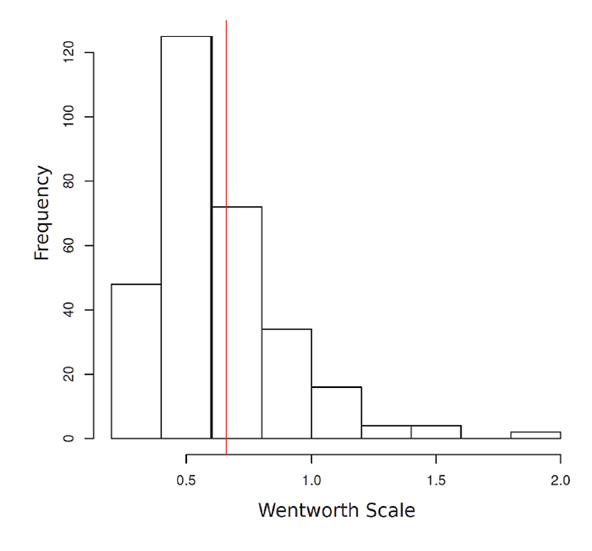
Fig. A9. Frequency distributions for expression levels of 305 genes shared between all 24 L. elliptica investigated obtained by tagged 454 sequence analysis. The Hsp70 value obtained from QPCR of 0.66, represented by the red line, was close to the mean of the distribution (0.62).