Ecological Archives E096-176-A1
Nameer R. Baker and Steven D. Allison. 2015. Ultraviolet photodegradation facilitates microbial litter decomposition in a Mediterranean climate. Ecology 96:1704–1713. http://dx.doi.org/10.1890/14-1482.1
Appendix A. Effects of experimental treatments on litter moisture over the course of the study.
Table A1. P values from ANOVA for litter moisture with respect to UV treatment, litter type, time of sampling, and all possible interactions. Significant (p < 0.05) p-values are bolded. Ndf and Ddf are the degrees of freedom for the numerator and denominator of the F statistic, respectively.
|
UV |
Litter (L) |
Time (T) |
UV:L |
UV:T |
L:T |
UV:L:T |
Litter moisture |
0.040 |
<0.001 |
<0.001 |
0.645 |
0.555 |
0.392 |
0.963 |
Ndf, Ddf |
1, 73 |
1, 73 |
3, 73 |
1, 73 |
3, 73 |
3, 73 |
3, 73 |
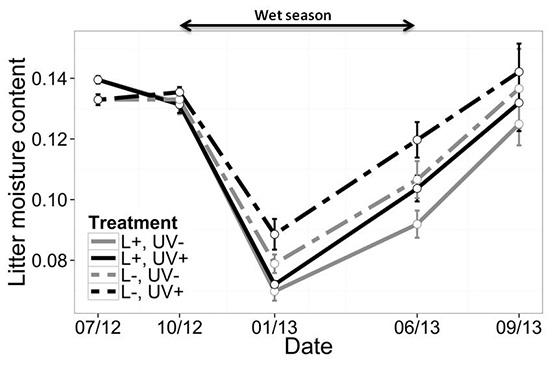
Fig. A1. Litter moisture content as fraction of total litter mass. Low lignin samples (L-) are shown with dotted lines, and high lignin samples (L+) with solid lines. UV pass treatments (UV+) are shown in black, UV block treatments (UV-) are in gray. Symbols represent means ± SE. The double-headed line above the plot indicates the duration of the wet season.