Ecological Archives E096-175-A2
Jeff R. Powell, Allana Welsh, and Sara Hallin. 2015. Microbial functional diversity enhances predictive models linking environmental parameters to ecosystem properties. Ecology 96:16951703. http://dx.doi.org/10.1890/14-1127.1
Appendix B. Rank-abundance distributions within denitrifier communities characterized from the Logården samples and covariation in the relative abundances of abundant denitrifier genotypes.
Observed rank-abundance distributions are typical of other microbial communities
Microbial communities tend to be dominated by a few highly abundant taxa and contain many rare types (Pedrós-Alió 2006), but the evenness estimates in our study were quite high (0.86, on average). These evenness estimates can be reconciled with the canonical microbial rank-abundance distribution by the limitations of DNA fingerprinting (and PCR in general) to detect rare taxa. The rank abundance distributions observed here (Fig. B1) match that of the detectable community described in Pedros-Alio (2006); modifying the species-abundance matrix so that all undetected taxa are detected at very low abundance (0.001 %) results in evenness decreasing from, on average, 0.86 to 0.66. So the actual gradient of evenness among communities may be larger than what the estimates suggest.
Fig. B1. Rank-abundance distributions of nirS (red) and nirK (blue) denitrifier communities from the Logården samples. Each line represents an individual sample.
The most abundant taxa are not necessarily the best predictors
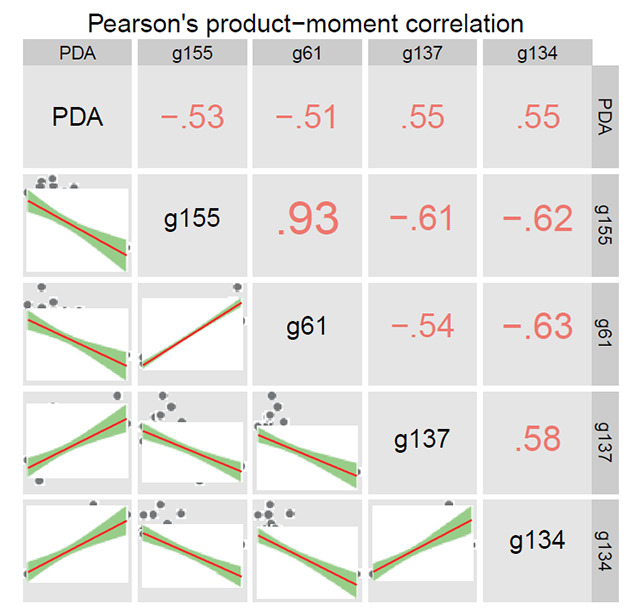
Previous studies of denitrifier communities have postulated that variation in denitrification is driven by variation in the abundance of particular denitrifier taxa (for example, Jayakumar et al. 2009). However, we did not find this to be the case in our analyses. The three most abundant nirS genotypes (on average, making up 22, 10, and 5 % of the nirS community), along with a fourth (genotype 134, ranging from 0 to 4.5 % of the nirS community) were correlated with denitrification potential when analyzed in isolation, but two of these (genotypes 155 and 61), were determined to not explain significant variation when considering all four genotypes that were identified in the initial screen. This is not surprising given the significant covariance observed in the abundances of these genotypes (see Fig. B2).
Fig. B2. Raw correlations among the relative abundances of four nirS genotypes, demonstrating significant covariation, and between each genotype and potential denitrification (PDA).
Literature cited
Jayakumar, A., G. D. O’Mullan, S. W. A. Naqvi, and B. B. Ward. 2009. Denitrifying bacterial community composition changes associated with stages of denitrification in oxygen minimum zones. Microbial Ecology 58:350–362.
Pedrós-Alió, C. 2006. Marine microbial diversity: can it be determined? Trends in Microbiology 14:257–263.