Ecological Archives E096-173-A3
Sarah L. Amundrud and Diane S. Srivastava. 2015. Drought sensitivity predicts habitat size sensitivity in an aquatic ecosystem. Ecology 96:16671675. http://dx.doi.org/10.1890/14-1828.1
Appendix C. Figures showing results from analyses assuming exponential larval growth rates.
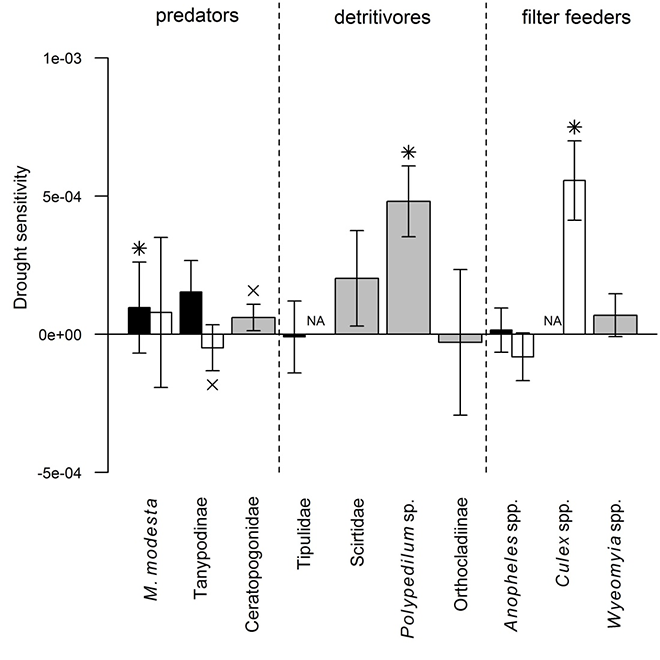
Fig. C1. Drought sensitivities of bromeliad insects assuming exponential insect growth. Drought sensitivity was measured as the negative (i.e., multiplied by -1) slope of relative growth rate (%) calculated from ln-transformed insect length regressed against drought length (days). Black: full drought (no water), white: partial drought (10% of ambient water), gray: the two drought levels combined (when model resulted in no significant effect of drought levels). p < 0.05 indicated by *, p < 0.1 indicated by x. Error bars show standard error of slope.
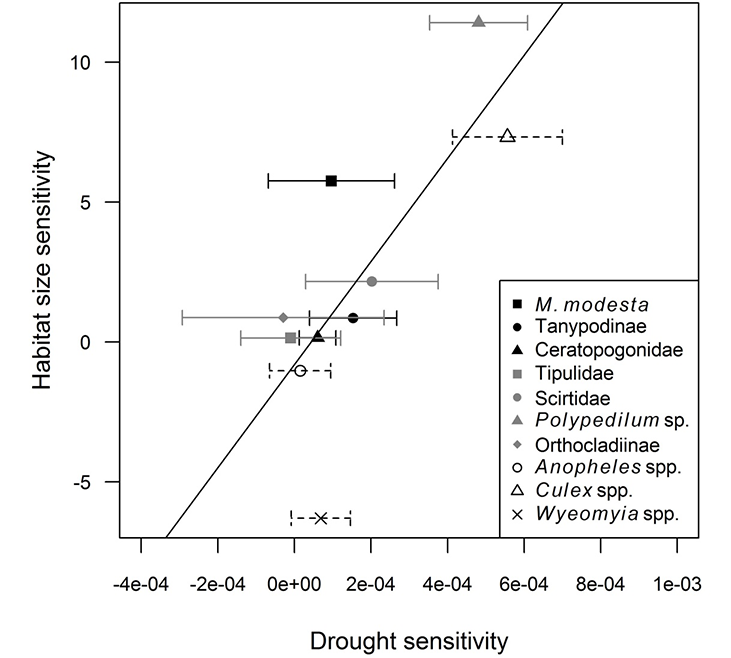
Fig. C2. Drought sensitivity predicts habitat size sensitivity in bromeliad insects. Habitat size sensitivity was measured as the Z score comparing the observed vs. expected mean habitat size of larval occurrence. Higher Z scores indicate a higher sensitivity to drought. Drought sensitivity was measured as in Fig. A1. For taxa for which drought level was significant (Mecistogaster modesta, Tanypodinae, Anopheles spp.), as well as for Tipulidae, drought sensitivity indices were obtained from full drought models. For Culex spp., the partial drought model was used, and when drought level had no effect (all other insects), the simplified models (with no drought level factor) were used to obtain drought sensitivity indices.Black/solid: predators; grey/solid: detritivores; empty/dashed: filter feeders. Different taxa within the three feeding groups are indicated by different symbols. Error bars represent standard errors. Solid line shows linear model prediction (R² = 0.54, F1,8 = 9.48, p = 0.015; analysis includes the outlier Wyeomyia spp.).