Ecological Archives E096-173-A2
Sarah L. Amundrud and Diane S. Srivastava. 2015. Drought sensitivity predicts habitat size sensitivity in an aquatic ecosystem. Ecology 96:16671675. http://dx.doi.org/10.1890/14-1828.1
Appendix B. Effect of drought on insect survival and emergence.
Methods
To explore the effects of drought length and level on insect larval survival, we employed logistic generalized linear models (GLMs) with binomial errors. Insects that emerged during the experiment were excluded from the analysis, as we did not know what length of drought insects had been exposed to at the time of their emergence. For each species, we started with a full model including the terms drought length, drought level, and their interaction. When drought level was not significant (p > 0.05; for all species except Culex spp.), we simplified the model by removing the drought level term.
To explore the effects of drought on insect emergence, we repeated the above analysis on insect emergence. Individuals that did not emerge were those that perished during the experiment or survived as larvae or pupae. However, when reducing the data set to include only insects that survived, the results were qualitatively identical. As emergences were overall rare (between 0% and 33% depending on species, Table B1), we were only able to perform the analysis on three species (Ceratopogonidae, Polypedilum sp., and Tanypodinae).
Results
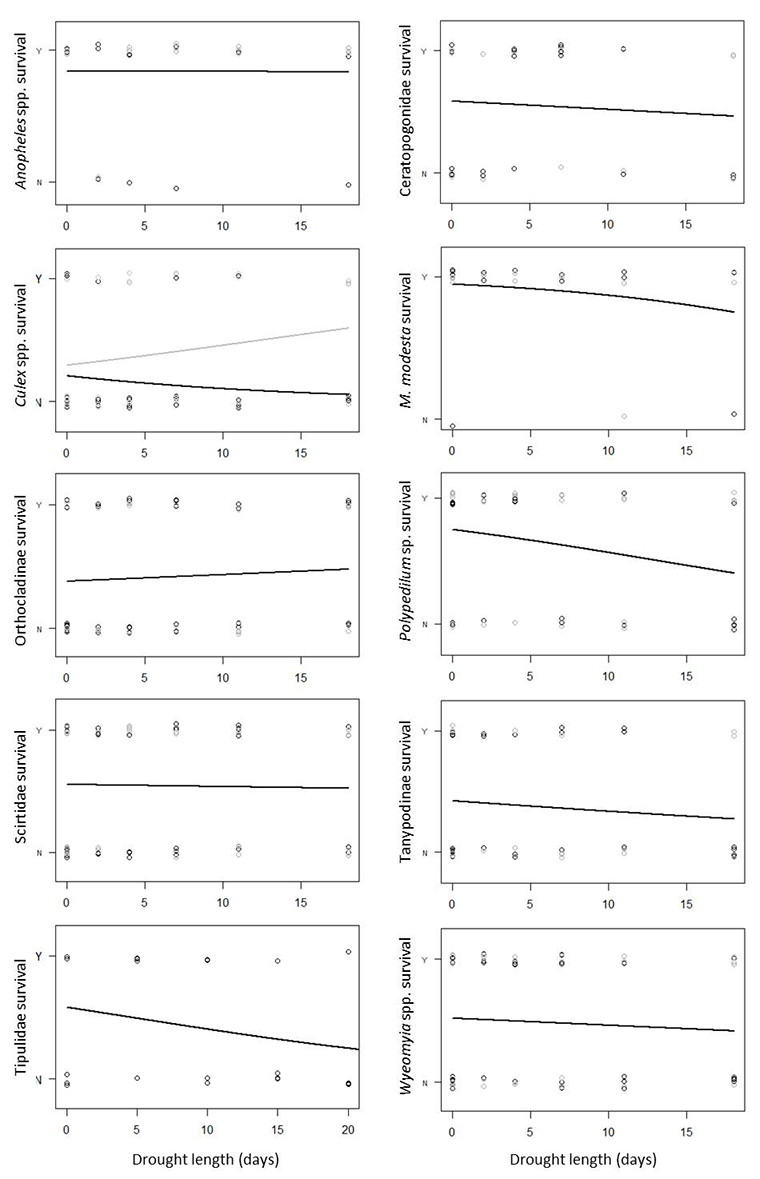
Mortality rates ranged from 11% to 73% depending on taxa (Table B1), and were generally not related to drought length and/or level (Fig. B1). Drought level had no effect on any species (p > 0.25) except Culex spp. (p = 0.020), which had higher mortalities under full drought than partial drought. Similarly, drought length did not affect the survival of any species (p > 0.2 for all species except Polypedilum sp. with p = 0.062), suggesting that the drought lengths used in the experiment were not long enough to affect larval mortality.
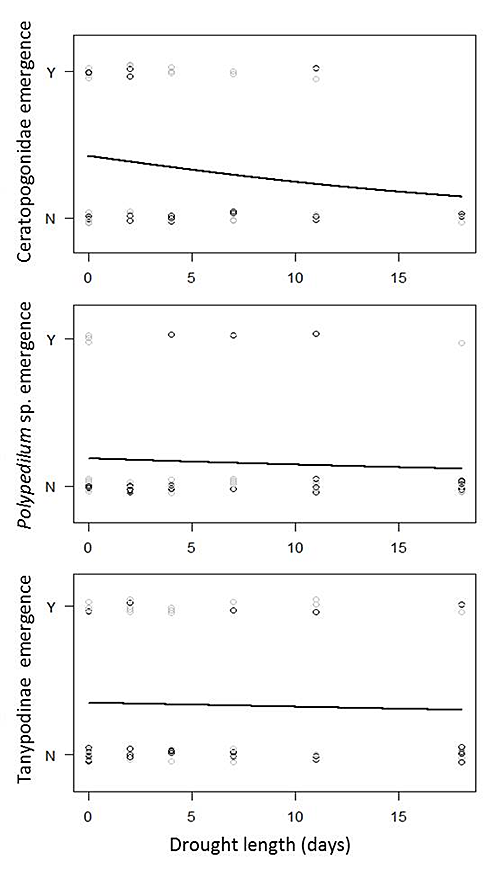
Emergence rates depended on insect taxa (ranging from 0% to 33%; Table B1), and were not affected by drought. For the three taxa with enough emergences to allow for analyses (Ceratopogonidae, Polypedilum sp., and Tanypodinae), neither drought level nor drought length significantly affected emergence (drought level: p > 0.05; drought length: p > 0.1; Fig. B2).
Table B1. Fates of bromeliad insects in mesocosm experiment. N(initial) gives numbers of individuals per taxon that were subjected to the mesocosm experiment, N(emerged) and N(died) give numbers of individuals that emerged or died, respectively, during the experiment.
Taxon |
N(initial) |
N(emerged) |
N(died) |
Mortality (%) |
Emergence (%) |
Anopheles spp. |
37 |
0 |
6 |
0.16 |
0.00 |
Ceratopogonidae |
52 |
17 |
16 |
0.31 |
0.33 |
Culex spp. |
70 |
0 |
51 |
0.73 |
0.00 |
Mecistogaster modesta |
28 |
0 |
3 |
0.11 |
0.00 |
Orthocladiinae |
70 |
2 |
40 |
0.57 |
0.03 |
Polypedilum sp. |
68 |
11 |
21 |
0.31 |
0.16 |
Scirtidae |
84 |
3 |
37 |
0.44 |
0.04 |
Tanypodinae |
69 |
23 |
29 |
0.42 |
0.33 |
Tipulidae |
25 |
3 |
13 |
0.52 |
0.12 |
Wyeomyia spp. |
70 |
2 |
35 |
0.50 |
0.03 |
Fig. B1. Drought length had no effect on the survival of bromeliad insects. When drought level was not significant (i.e., p > 0.05; all taxa except Culex spp.), predictions from the simplified model (without drought level) are shown. Black dots show survival under full drought, gray dots show survival under partial drought. Black line represents binomial model predictions from simplified model for all species except Culex spp. and Tipulidae, for which the black line represents model predictions under full drought. Gray line represents model predictions under partial drought (only for Culex spp.).
Fig. B2. Drought did not affect bromeliad insect emergence. Analyses were only possible for taxa with sufficient numbers of emergences (Ceratopogonidae, Polypedilum sp., and Tanypodinae). As drought level was not significant (all taxa), predictions from the simplified model (without drought level) are shown. Black dots show emergences under full drought, gray dots show emergences under partial drought. Black line represents binomial model predictions from simplified model.