Ecological Archives E096-173-A1
Sarah L. Amundrud and Diane S. Srivastava. 2015. Drought sensitivity predicts habitat size sensitivity in an aquatic ecosystem. Ecology 96:16671675. http://dx.doi.org/10.1890/14-1828.1
Appendix A. The size distribution of surveyed bromeliads in relation to insect occurrences.
Table A1. Frequency of occurrence, body size, and habitat size components for bromeliad insect larvae. FG represents functional group (P: predator; D: detritivore; F: filter feeder); abd represents total abundance over all surveyed bromeliads; mass (mg) represents maximum dry mass of insect larvae. meanobs represents observed mean bromeliad size of occurrence; meannull represents mean bromeliad size of occurrence expected from random species assembly; SDnull represents standard deviation of expected mean bromeliad size obtained from randomization (resampled 10,000 x). From these three components, we calculated habitat size sensitivity indices (Z) and their associated p values (p).
Bromeliad insect larvae |
Habitat size of occurrence |
|||||||
Taxon |
FG |
abd |
mass (mg) |
meanobs |
meannull |
SDnull |
Z |
p |
Mecistogaster modesta |
P |
121 |
12.29 |
476.39 |
370.67 |
18.37 |
5.75 |
<0.001 |
Tanypodinae |
P |
221 |
0.04 |
360.82 |
350.14 |
12.49 |
0.86 |
0.392 |
Ceratopogonidae |
P |
184 |
0.04 |
358.08 |
356.01 |
14.06 |
0.15 |
0.883 |
Tipulidae |
D |
1529 |
5.50 |
315.12 |
314.53 |
4.31 |
0.14 |
0.891 |
Scirtidae |
D |
4627 |
1.07 |
314.42 |
308.87 |
2.57 |
2.15 |
0.031 |
Polypedilum sp. |
D |
4579 |
0.04 |
338.72 |
308.91 |
2.61 |
11.41 |
<0.001 |
Orthocladiinae |
D |
1382 |
0.03 |
319.28 |
315.39 |
4.49 |
0.87 |
0.386 |
Anopheles spp. |
F |
152 |
1.29 |
346.23 |
362.51 |
15.8 |
-1.03 |
0.303 |
Culex spp. |
F |
188 |
0.48 |
458.11 |
355.30 |
14.04 |
7.32 |
<0.001 |
Wyeomyia spp. |
F |
377 |
1.29 |
279.38 |
335.61 |
8.92 |
-6.30 |
<0.001 |
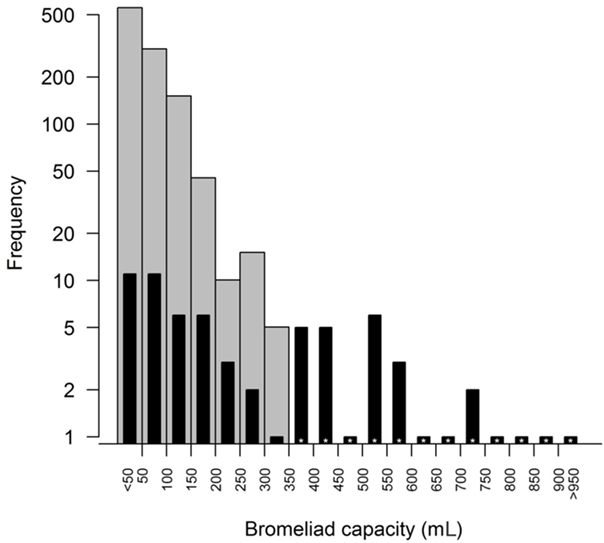
Fig. A1. Natural and surveyed size distribution of forest bromeliads. Gray histogram represents density of randomly sampled forest bromeliads (> 15 cm in diameter) per hectare obtained from data originally published in Melnychuk and Srivastava (2002). These bromeliads have a mean water holding capacity of 65.55 mL (± 54.96 SD, n = 215), and were sampled over an area of 1984.5 m². Black histogram represents density of bromeliads from the survey in the current study. These bromeliads have a mean water holding capacity of 305.20 mL (± 286.61 SD, n = 68). Bars of black histogram are slim to improve clarity. * indicates that the natural density in this size class was greater than zero but less than 5/ha, the detection limit of the bromeliad survey in Melnychuk and Srivastava (2002). Note that frequency is on a log-scale.
Literature cited
Melnychuk, M. C., and D. S. Srivastava. 2002. Abundance and vertical distribution of a bromeliad-dwelling zygopteran larva, Mecistogaster modesta, in a Costa Rican rainforest (Odonata: Pseudostigmatidae). International Journal of Odonatology 5:81–97.