Ecological Archives E096-172-A1
Allert I. Bijleveld, Sönke Twietmeyer, Julia Piechocki, Jan A. van Gils, and Theunis Piersma. 2015. Natural selection by pulsed predation: survival of the thickest. Ecology 96:16531666. http://dx.doi.org/10.1890/14-1845.1
Appendix A. Figures showing the study area and the allometric relations between cockle length and body composition, and a table showing the mixed-modeling results for the effects of predation on a cockles relative body composition.
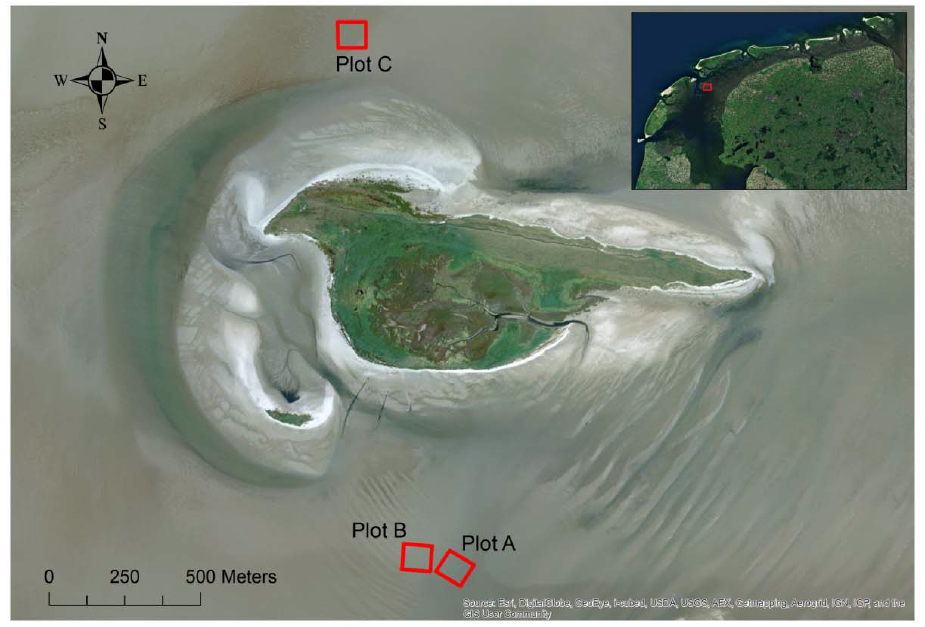
Fig. A1. Map of the study area. Our study area was situated near the islet of Griend in the Dutch Wadden Sea (53°14.615'N, 5°15.219'E). The three study plots of 100 × 100 m are outlined in red.
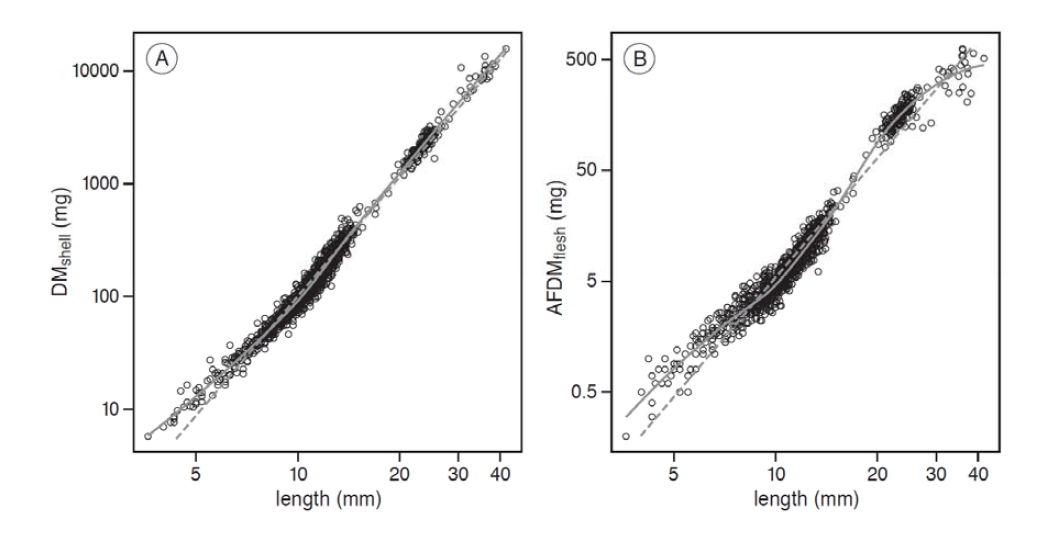
Fig. A2. Allometric relations between cockle length and body composition. Normally, allometric relationships are analyzed with linear regression on a log-log scale (dashed lines). Because of remaining non-linearity in these allometric relationships, we fitted non-linear local regression models (LOESS, solid lines). We obtained an individual’s relative body composition by extracting its residual from these regressions for (A) dry mass of the shell (DMshell), or (B) ash-free dry mass of the flesh (AFDMflesh) with length on a log-log scale.
Table A1. Mixed-modeling results for the effects of predation on a cockle’s relative body composition.
|
response variables |
random effect |
predictors |
est. |
SE |
P |
(A) |
relative DMshell |
|
intercept |
-0.01 |
0.01 |
0.23 |
|
|
|
final sampling |
0.01 |
0.01 |
0.47 |
|
|
|
predated |
0.02 |
0.01 |
0.18 |
|
|
|
final sampling × predated |
0.07 |
0.02 |
<0.01 |
|
|
sampling station |
0.03 |
0.00 |
<0.01 |
|
|
|
residual |
0.07 |
0.00 |
<0.01 |
|
(B) |
relative AFDMflesh |
|
intercept |
-0.05 |
0.02 |
0.01 |
|
|
|
final sampling |
0.05 |
0.02 |
0.01 |
|
|
|
predated |
0.10 |
0.02 |
<0.01 |
|
|
|
final sampling × predated |
-0.03 |
0.03 |
0.42 |
|
|
sampling station |
0.06 |
0.01 |
<0.01 |
|
|
|
residual |
0.07 |
0.00 |
<0.01 |
|
Note: The mixed-modelling results for the effects of predation on an individual’s relative (A) dry mass of the shell (DMshell), and (B) ash-free dry mass of the flesh (AFDMflesh). The predictor ‘intercept’ refers to the mean values at the initial sampling occasion in the reference plot. The other predictors give the difference of the intercept with the final sampling in the reference plot (‘final sampling’), the initial sampling in the predated plots (‘predated’), and the final sampling in the predated plots (‘final sampling × predated’). The random effect estimates refer to standard deviations. Note that we limited these analyzes to cockles that red knots are able to ingest (lengths < 16 mm).