Ecological Archives E096-170-A2
Erin L. Kurten, S. Joseph Wright, and Walter P. Carson. 2015. Hunting alters seedling functional trait composition in a Neotropical forest. Ecology 96:1633–1642. http://dx.doi.org/10.1890/14-1735.1
Appendix B. Tables of statistical results and figure of community mean wood density for tree species.
For details of statistical methods, see “Methods” in the main text. Tables and figures include tree and liana species in all analyses, unless otherwise noted. The “intercept” estimate parameter, where given, is the control treatment of the exclosure experiment and is the reference state for all other model parameters.
Table B1. The percentage of total individuals and species for which trait data was available for testing predictions.
|
Exclosure Trait Coverage |
|
Hunting Comparison Trait Coverage |
||
Trait |
Individuals |
Species |
|
Individuals |
Species |
Seed dispersal agent |
94.9% |
88.0% |
|
90.2% |
91.4% |
Dry seed mass |
84.3% |
61.8% |
|
65.1% |
59.9% |
Leaf toughness |
84.9% |
67.9% |
|
56.1% |
65.6% |
Wood density |
90.1% |
77.9% |
|
79.8% |
78.5% |
Growth form |
97.6% |
74.8% |
|
88.3% |
87.8% |
LMA |
86.7% |
67.9% |
|
62.6% |
66.3% |
Table B2. GLM results for proportion of individuals with hunted dispersal agents.
Fixed effects |
Estimate ± Std. Err. |
z value |
p value |
Intercept (control) |
-0.323 ± 0.031 |
-10.56 |
< 0.001 |
Vertebrate reduction |
0.256 ± 0.039 |
6.59 |
< 0.001 |
Driver |
0.580 ± 0.038 |
15.45 |
< 0.001 |
Vertebrate reduction × Driver |
-1.194 ± 0.049 |
24.12 |
< 0.001 |
Table B3. GLM results for proportion of individuals with both hunted and non-hunted dispersal agents.
Fixed effects |
Estimate ± Std. Err. |
z value |
p value |
Intercept (control) |
-1.57 ± 0.040 |
38.906 |
< 0.001 |
Vertebrate reduction |
0.277 ± 0.050 |
5.591 |
< 0.001 |
Driver |
0.209 ± 0.048 |
4.333 |
< 0.001 |
Vertebrate reduction × Driver |
-0.503 ± 0.062 |
-8.042 |
< 0.001 |
Table B4. GLM results for proportion of individuals with non-hunted dispersal agents.
Fixed effects |
Estimate ± Std. Err. |
z value |
p value |
Intercept (control) |
-0.370 ± 0.031 |
-11.94 |
< 0.001 |
Vertebrate reduction |
-0.468 ± 0.041 |
-11.61 |
< 0.001 |
Driver |
-0.825 ± 0.040 |
-20.64 |
< 0.001 |
Vertebrate reduction × Driver |
1.64 ± 0.052 |
31.66 |
< 0.001 |
Table B5. GLM results for proportion of individuals with climbing growth forms (lianas).
Fixed effects |
Estimate ± Std. Err. |
z value |
p value |
Intercept (control) |
-0.945 ± 0.035 |
-27.313 |
< 0.001 |
Vertebrate reduction |
-0.344 ± 0.045 |
-7.608 |
< 0.001 |
Driver |
-0.480 ± 0.044 |
-10.907 |
< 0.001 |
Vertebrate reduction × Driver |
1.756 ± 0.057 |
30.983 |
< 0.001 |
Table B6. LM results for mean log(seed dry mass).
Fixed effects |
Estimate ± Std. Err. |
t value |
p value |
Intercept (control) |
-2.486 ± 0.183 |
-13.603 |
< 0.001 |
Vertebrate reduction |
0.383 ± 0.258 |
1.481 |
0.148 |
Driver |
0.597 ± 0.251 |
2.377 |
0.023 |
Vertebrate reduction × Driver |
-0.504 ± 0.348 |
-1.452 |
0.156 |
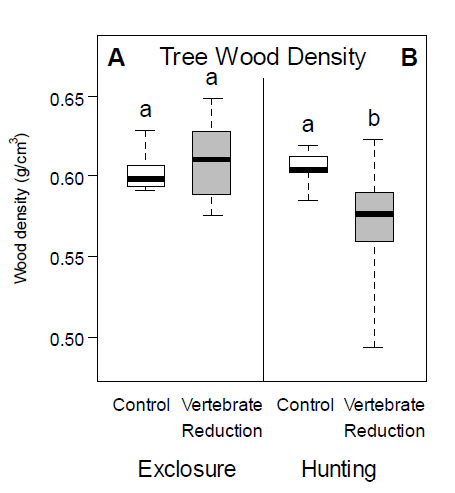
Table B7. LM results for mean wood density.
Fixed effects |
Estimate ±Std. Err. |
t value |
p value |
Intercept (control) |
0.566 ± 0.008 |
73.559 |
< 0.001 |
Vertebrate reduction |
0.007 ± 0.011 |
0.603 |
0.551 |
Driver |
0.024 ± 0.011 |
2.317 |
0.027 |
Vertebrate reduction × Driver |
-0.044 ± 0.015 |
-2.993 |
0.005 |
Table B8. LM results for mean LMA.
Fixed effects |
Estimate ± Std. Err. |
t value |
p value |
Intercept (control) |
59.15 ± 1.71 |
34.632 |
< 0.001 |
Vertebrate reduction |
-0.95 ± 2.42 |
-0.394 |
0.696 |
Driver |
1.44 ± 2.35 |
0.612 |
0.545 |
Vertebrate reduction × Driver |
0.62 ± 3.25 |
0.190 |
0.851 |
Table B9. LM results for mean log(laminar toughness).
Fixed effects |
Estimate ± Std. Err. |
t value |
p value |
Intercept (control) |
6.131 ± 0.032 |
191.2 |
< 0.001 |
Vertebrate reduction |
0.021 ± 0.045 |
0.473 |
0.640 |
Driver |
0.119 ± 0.044 |
2.706 |
0.011 |
Vertebrate reduction × Driver |
-0.097 ± 0.061 |
-1.587 |
0.122 |
Table B10. Effects of vertebrate exclosure on functional traits and effects of hunting on functional traits, analyzed separately. Significant results are in bold text.
Response variable |
Exclosure Experiment |
Hunting Comparison |
Proportion of individuals with |
|
|
Hunted dispersal agents |
P < 0.001 |
P < 0.001 |
Mixed dispersal agents |
P < 0.001 |
P < 0.001 |
Non-hunted dispersal agents |
P < 0.001 |
P < 0.001 |
Climbing growth forms |
P < 0.001 |
P < 0.001 |
Community mean |
|
|
Seed mass |
P < 0.001 |
P = 0.685 |
Wood density |
P = 0.308 |
P = 0.003 |
LMA |
P = 0.622 |
P = 0.887 |
Leaf toughness |
P = 0.448 |
P = 0.141 |
Fig. B1. Responses of seedling community mean wood density to vertebrate reduction caused by (A) exclosures and (B) hunting, for tree species only. The heavy horizontal lines represent medians, boxes represent first and third quartiles, and whiskers represent extreme values. Lower-case letters distinguish groups that are significantly different from one another, where a two-way analysis of exclosure and hunting data together identified a significant interaction between main effects.