Ecological Archives E096-167-A3
Sarah H. Pasquini, S. Joseph Wright, and Louis S. Santiago. 2015. Lianas always outperform tree seedlings regardless of soil nutrients: results from a long-term fertilization experiment. Ecology 96:15761586. http://dx.doi.org/10.1890/14-1660.1
Appendix C. Figures showing the average of total transmission of light above liana and tree seedlings used in study, and responses to full-factorial nitrogen, phosphorus, and potassium addition compared to unfertilized controls for physiological and morphological traits.
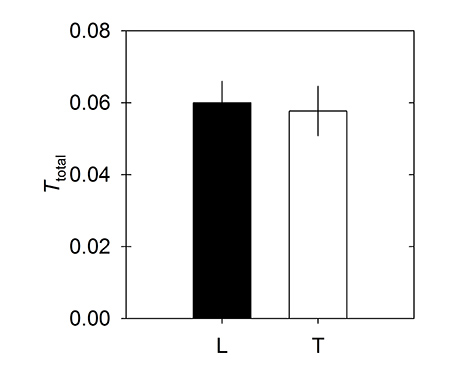
Fig. C1. Total transmission of light (Ttotal; proportion of above-canopy ambient) over study seedlings. Liana and tree seedlings are represented by L and black bars, and T and open bars, respectively. All nutrient treatments and controls are pooled. Bars represent means (± 1 SE). There was no significant difference between Ttotal for liana and tree seedlings (T395 = 0.60, P = 0.44).
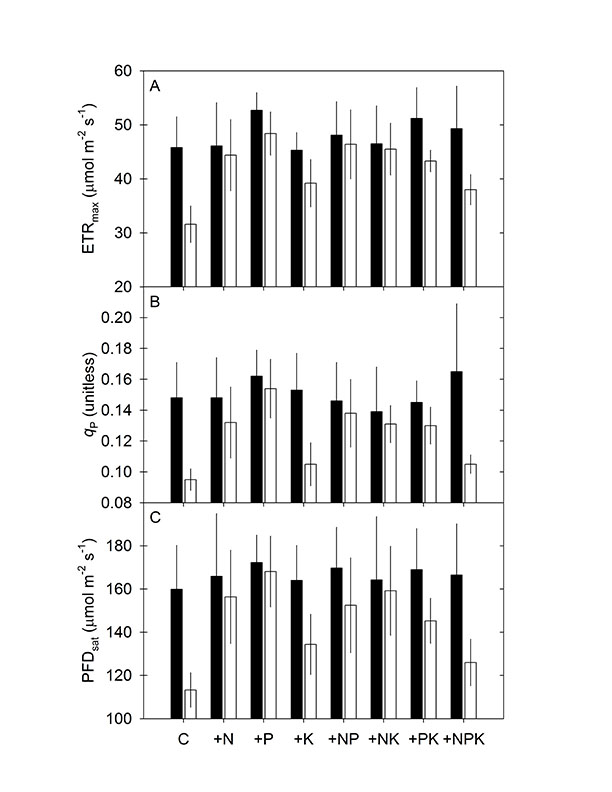
Fig. C2. Responses of liana and tree seedlings to full-factorial nitrogen (N), phosphorus (P), and potassium (K) addition and unfertilized controls (C) for (A) maximum electron transport rate (ETRmax), (B) photochemical quenching coefficient (qP), and (C) saturating photon flux density (PFDsat). Liana and tree seedlings are represented by black bars and open bars, respectively. Bars represent means (± 1 SE; N = 4 plots per treatment).
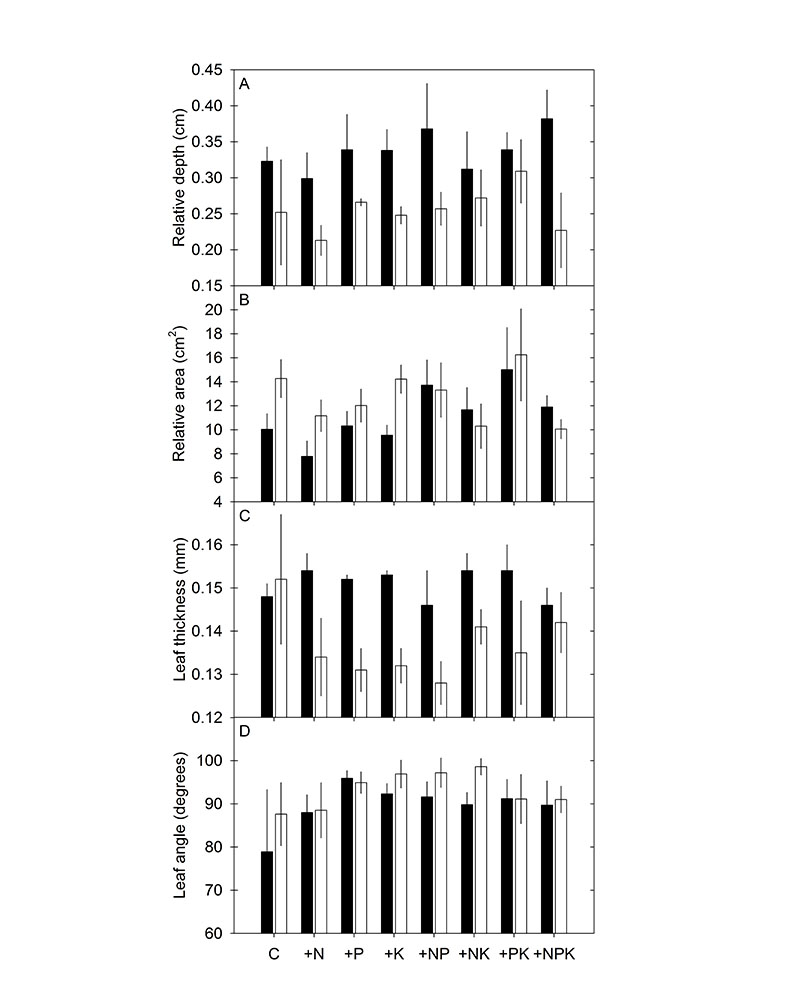
Fig. C3. Responses of liana and tree seedlings to full-factorial nitrogen (N), phosphorus (P), and potassium (K) addition and unfertilized controls (C) for (A) relative crown depth, (B) relative crown area, (C) leaf thickness, and (D) leaf angle. Liana and tree seedlings are represented by black bars and open bars, respectively. Bars represent means (± 1 SE; N = 4 plots per treatment).
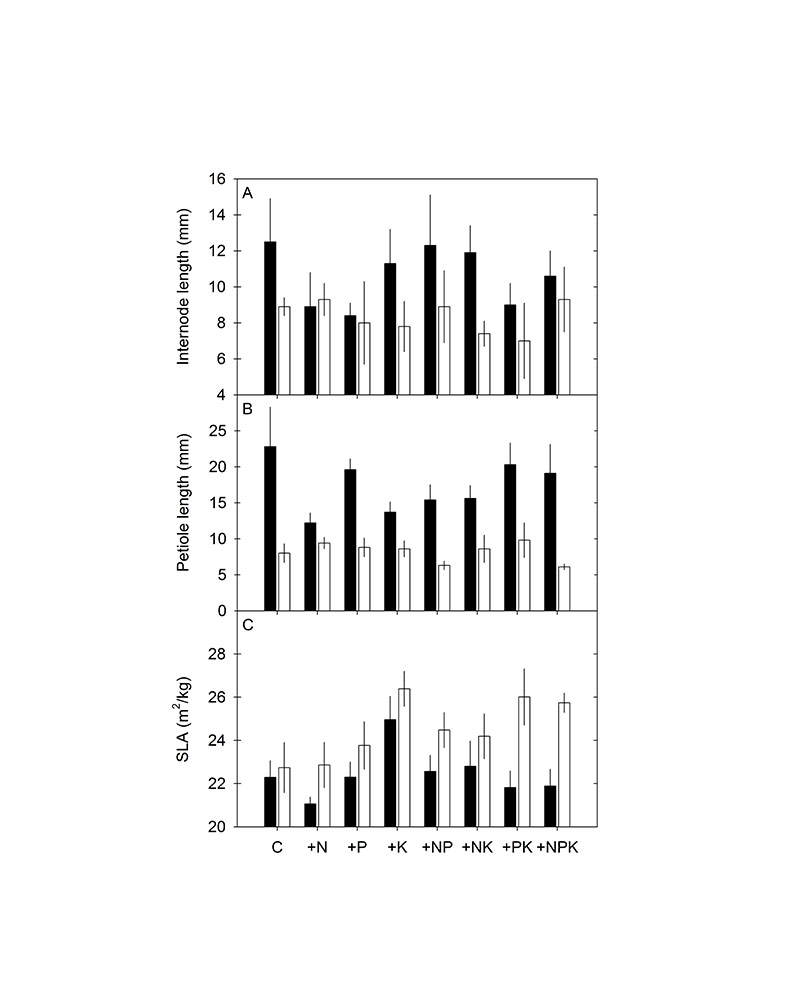
Fig. C4. Responses of liana and tree seedlings to full-factorial nitrogen (N), phosphorus (P), and potassium (K) addition and unfertilized controls (C) for (A) internode length, (B) petiole length, and (C) specific leaf area (SLA). Liana and tree seedlings are represented by black bars and open bars, respectively. Bars represent means (± 1 SE; N = 4 plots per treatment).