Ecological Archives E096-159-A2
Adrianne P. Smits, Daniel E. Schindler, and Michael T. Brett. 2015. Geomorphology controls the trophic base of stream food webs in a boreal watershed. Ecology 96:14851492. http://dx.doi.org/10.1890/14-2247.1
Appendix B. Relationships between watershed slope and other geomorphic characteristics in the Wood River System.
Results from two previous studies conducted within the Wood River basin in SW Alaska provide evidence that watershed slope is a dominant underlying control on physical and biological processes in streams. Lisi et al. (2013) found strong correlations between five watershed geomorphic characteristics (mean slope, watershed area, mean elevation, mean stream substrate size (D84), and total lake area), stream temperatures, and salmon spawn timing. A principal component analysis of the geomorphic attributes of 36 watersheds showed mean slope to be one of the strongest drivers of variation among sites, and that slope was highly correlated with mean elevation and stream substrate size. Jankowksi et al. (2014) found additional correlation between watershed geomorphology and the carbon quantity and quality in streams: watershed slope alone explained 68% of the variation in DOC concentration among streams.
Given that 11 out of 16 of our own study streams were included in the Lisi et al. (2013) analysis, and 4 out of 16 included in the Jankowski et al. (2014), we hypothesized that watershed slope, by determining stream conditions such as temperature, carbon quantity, and carbon quality, would also ultimately influence the trophic base of food webs within this system. We performed a PCA of the same geomorphic variables used in the Lisi et al. (2013) analysis on 11 of our study streams for which all such data currently exists (some streams lack substrate size measurements), and also added average summer stream temperature as a variable. We then used the resulting PC scores in regressions against our invertebrate FA data in order to test whether using watershed slope alone as a predictor was sufficient, or whether additional variables added significant explanatory power.
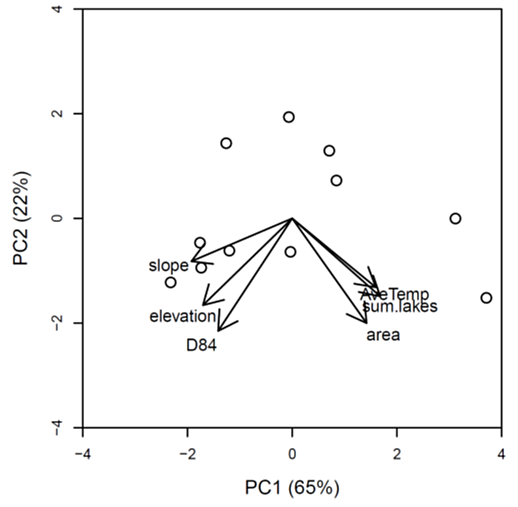
Results: The first two principal component axes explained 65% and 22% of the variation among streams respectively, though only the first axis was significant (p <0.0001, Fig. B1). Watershed slope was strongly negatively correlated with PC1 (Table B1). Because PC2 did not explain significant variation among sites, we did not use it as a predictor in regressions.
While for some FA, using PC1 score as a predictor resulted in significantly better model fits than using only watershed slope (branched, MOB, and total FA in caddisflies, sulfate-reducing FA in mayflies), for most others it did not (Table B2).Given our original hypothesis, as well as the high correlation among geomorphic variables in the PCA, we retained watershed slope as the sole predictor variable in further analyses, rather than introduce additional explanatory variables.
Fig. B1. Ordination biplot showing first two PC axes (only PC1 is significant). Open circles represent the 11 study streams included in the analysis, and vectors represent the loading of each geomorphic variable onto the pc axes. Data points close together share more similar geomorphic attributes than those that are far apart.
Table B1. Correlations between PC scores of each watershed and the original geomorphic variables.
Geomorphic variable |
Correlation with PC1 |
Correlation with PC2 |
Mean slope (°) |
-0.953 |
-0.24 |
Mean elevation (meters above sea level) |
-0.844 |
-0.485 |
Watershed area (km2) |
0.703 |
-0.585 |
D84 (substrate size) |
-0.7 |
-0.629 |
Sum.lakes (total lake area in the watershed, km2 ) |
0.832 |
-0.436 |
AveTemp (mean summer stream temperature, ° C) |
0.791 |
-0.385 |
Table B2. Comparisons of regressions between geomorphic variables (either mean watershed slope or PC1 score, a linear combination of six variables) and FA proportions in invertebrates. Analyses were performed on a subset of the full data (11 out of 16 streams) for which all geomorphic attributes (slope, area, elevation, substrate size, lake area, temperature) were known.
|
|
Predictor |
|
Invertebrate Group |
Response variable |
Slope |
PC1 |
Caddisfly |
Total FA |
R² = 0.25; p < 0.01 |
R² = 0.33; p < 0.001 |
Caddisfly |
Algal FA |
R² = 0.32; p < 0.001 |
R² = 0.33; p < 0.001 |
Caddisfly |
SAFA |
p = 0.4 |
p = 0.23 |
Caddisfly |
Branched FA |
R² = 0.36; p < 0.001 |
R² = 0.45; p < 0.0001 |
Caddisfly |
MOB FA |
R² = 0.07; p < 0.1 |
R² = 0.20; p < 0.01 |
Caddisfly |
Sulfate-reducing FA |
R² = 0.35; p < 0.0001 |
R² = 0.33; p < 0.001 |
Mayfly |
Total FA |
p = 0.67 |
p = 0.76 |
Mayfly |
Algal FA |
p = 0.18 |
p = 0.16 |
Mayfly |
SAFA |
p = 0.24 |
p = 0.13 |
Mayfly |
Branched FA |
p = 0.52 |
p = 0.68 |
Mayfly |
MOB FA |
R² = 0.33; p < 0.01 |
R² = 0.36; p < 0.001 |
Mayfly |
Sulfate-reducing FA |
R² = 0.16; p < 0.05 |
R² = 0.32; p < 0.01 |
Literature cited
Jankowski, K., D. E. Schindler, and P. J. Lisi. 2014. Temperature sensitivity of community respiration rates in streams is associated with watershed geomorphic features. Ecology 95:2707–2714.
Lisi, P. J., D. E. Schindler, K. T. Bentley, and G. R. Pess. 2013. Association between geomorphic attributes of watersheds, water temperature, and salmon spawn timing in Alaskan streams. Geomorphology 185:78–86.