Ecological Archives E096-158-A1
Liz Koziol and James D. Bever. 2015. Mycorrhizal response trades off with plant growth rate and increases with plant successional status. Ecology 96:14781484. http://dx.doi.org/10.1890/14-2208.1
Appendix A. Additional tables, methods, results, and figures showing root colonization, proc mixed results, and our reconstructed phylogeny.
Table A1. Each of our thirty plant species with their plant family and successional stage designation. We used the coefficient of conservatism (CC) score for each species (Swink and Wilhelm 1994) to assign successional stage classification (see Supplementary Methods 1 for more information about successional stage classifications). Plants receiving a CC score of 1 or 2 classified as very early successional, 3–4 early successional, 5–7 middle successional, and 8–10 late successional.
Successional Stage |
Plant Family |
Plant Species |
Very Early |
Poaceae |
Alopecurus hitchcockii |
Very Early |
Asteraceae |
Rudbeckia hirta |
Very Early |
Polygonaceae |
Rumex patientia |
Very Early |
Commelinaceae |
Tradescantia ohiensis |
Early |
Asteraceae |
Symphyotrichum novae-angliae |
Early |
Fabaceae |
Desmodium canedense |
Early |
Asteraceae |
Echinacea purpurea |
Early |
Poaceae |
Elymus canadensis |
Early |
Lamiaceae |
Monarda fitulosa |
Early |
Plantaginaceae |
Penstemon digitalis |
Early |
Asteraceae |
Ratibida pinnata |
Middle |
Poaceae |
Andropogon gerardii |
Middle |
Poaceae |
Bouteloua curtipendula |
Middle |
Asteraceae |
Coreopsis palmata |
Middle |
Asteraceae |
Coreopsis tripteris |
Middle |
Asteraceae |
Helianthus occidentalis |
Middle |
Asteraceae |
Liatris spicata |
Middle |
Lamiaceae |
Pycnanthemum virginianum |
Middle |
Poaceae |
Schizachyium scoparium |
Middle |
Asteraceae |
Silphium integrifolium |
Middle |
Asteraceae |
Silphium terebinthinaceum |
Middle |
Poaceae |
Sorghastrum nutans |
Late |
Amaryllidaceae |
Allium cernnum |
Late |
Fabaceae |
Amorpha canescens |
Late |
Asteraceae |
Echinacea pallida |
Late |
Apiaceae |
Eryngium yuccifolium |
Late |
Campanulaceae |
Lobelia cardinalis |
Late |
Asteraceae |
Solidago riddellii |
Late |
Poaceae |
Sporobolus heterolepis |
Late |
Apiaceae |
Zizia aurea |
Table A2. Growth effects for our 30 plant species. We analyzed total plant mass, root to shoot ratio, and the number of root tips per mass using a mixed model with species within successional stage identified as a random effect. We decomposed variation among successional stages the a priori orthogonal contrast of early (very early and early plants) vs. late (middle and late successional plants).
Total Mass |
Root:Shoot |
Tips per Mass |
|||||||
df |
F |
p |
F |
p |
F |
p |
|||
Initial size |
219 |
27.5 |
<0.0001 |
9.6 |
0.002 |
3 |
0.08 |
||
Successional stage |
21 |
8.4 |
0.0007 |
0.4 |
0.8 |
4.7 |
0.01 |
||
Early vs. Late |
21 |
23.4 |
<0.0001 |
0.8 |
0.4 |
4.4 |
0.05 |
||
Inoculation |
21 |
13.6 |
0.001 |
1.5 |
0.2 |
0.03 |
0.9 |
||
Successional stage × inoculation |
21 |
4.8 |
0.01 |
1.8 |
0.2 |
1.3 |
0.3 |
||
Early vs. Late |
21 |
12 |
0.002 |
2.5 |
0.1 |
1.6 |
0.2 |
||
Plant family |
21 |
4.4 |
0.007 |
0.6 |
0.7 |
10.2 |
<0.0001 |
||
Inoculation × plant family |
21 |
0.8 |
0.5 |
1.6 |
0.2 |
1.8 |
0.2 |
||
Est |
SE |
p |
Est |
SE |
p |
Est |
SE |
p |
|
Successional stage × plant × family |
0.1 |
0.05 |
0.02 |
0.02 |
0.008 |
0.002 |
0.5 |
0.2 |
0.002 |
Successional stage × plant × family |
0.07 |
0.03 |
0.003 |
0.003 |
0.002 |
0.03 |
0.08 |
0.03 |
0.009 |
× Soil |
|||||||||
Residual |
0.06 |
0.005 |
<0.001 |
0.01 |
0.001 |
<0.0001 |
0.1 |
0.01 |
<0.0001 |
Table A3. Proc Mixed Results for the BLUP means of the proportion of inoculated roots colonized by AM hyphae, arbuscules, and vesicles for plant family, plant successional stage, and the contrast of early successional plants vs. late successional plants.
Proportion Colonized by AM Fungal |
||||||||
Num |
Den |
Hyphae |
Arbuscules |
Vesicles |
||||
|
df |
df |
F |
P |
F |
P |
F |
P |
Successional Stage |
3 |
20 |
1.8 |
0.2 |
7.9 |
0.001 |
0.1 |
0.9 |
Early vs. Late |
1 |
20 |
5.1 |
0.04 |
23.1 |
0.0001 |
0 |
1 |
Linear |
1 |
20 |
5 |
0.04 |
16.8 |
0.0006 |
0.07 |
0.8 |
Plant Family |
5 |
20 |
2.8 |
0.05 |
2.65 |
0.05 |
0.5 |
0.7 |
Table A4. Phylogenetic multiple regression for plant mycorrhizal responsiveness using BLUP means.
|
Est. |
Std. Error |
T |
P |
Average Plant Mass |
-2.4 |
0.175 |
-13.7 |
1.60E-13 |
Root Tips per Mass |
-0.3 |
0.3 |
-1 |
0.3 |
|
|
|
|
|
Residual standard error |
3.364 on 27 degrees of freedom |
|
|
|
Multiple R squared: |
0.94 |
|
|
|
Adjusted R squared |
0.94 |
|
|
|
F statistic: |
213.9 on 2 and 27 df |
|
|
|
p: |
<2.2e-16 |
|
|
|
Methods 1.
To study the root architecture and the response of prairie plants to arbuscular mycorrhizal fungi, we selected thirty prairie plant species that included four very early successional species, seven early successional species, eleven middle successional species, and eight late successional species. Given that mycorrhizal responsiveness is known to vary across plant phylogeny (Hoeksema et al. 2010, Reinhart et al. 2012), we made efforts to choose both early and late successional species from across six plant families (Table A1). We used the coefficient of conservatism (CC) score for each species (Swink and Wilhelm 1994) as well as field observations to determine successional stage classification. The CC score for this area is correlated with successional stage because the region has many disturbed early successional environments dominated with plants with low conservation value and very few undisturbed late successional prairies in which plants with high conservation value are abundant. The CC scores for our plants are strongly correlated two sets of field observations describing the dominant plant assemblages in prairies of different ages ages (r = 0.66, df = 106, p < 0.0001,Betz et al. 1996; r = 0.63, df = 49, p < 0.0001, Schramm 1990). While observations of individual successional sequences do not provide information for the entire plant species pool, the CC scores are available for every plant species. Plants receiving a CC score of 1 or 2 classified as very early successional, 3–4 early successional, 5–7 middle successional, and 8–10 late successional.
Methods 2.
Plant and Fungal Material
Seeds were obtained from the Nature Conservancy’s Kankakee Sands Prairie in northern Indiana. We used a mixture of eight species of AM fungi originally isolated from remnant prairies in northern Indiana. Typical remnant prairies contain many of the early and late successional species used in this study (Betz and Cole 1969, Betz 1986, Schramm 1990, Betz et al. 1996). A similar mixture had previously been found to robustly promote prairie plant growth (Bauer et al. 2012)and the mixture provided benefit equivalent to the best individual AM fungal species (Vogelsang et al. 2006). Pure species cultures were grown with sorghum in a sterilized mixture of and and Indiana soil, the roots cut into 1 cm fragments, and then mixed together to create our AM fungal mixture. The AM fungal mixture included the following species listed in decreasing volume: Claroideoglomus claroideum, Racocetra fuldiga, Funneliformus mosseae, Cetraspora pellucida, Claroideoglomus lamellosum, Acaulospora spinosa, Paraglomus sp., and Entrophospora infrequens. Sterilized calcined clay was added to the AM fungal mixture to produce the same consistency as the background soil mix. The AM fungal pots were filled with 1950 cm3 of sterile soil with 50 cm3 of inoculum placed at the center depth. Each non-inoculated pot received 20 mL of a microbial filtrate prepared from the fungal mixture (Koide and Li 1989).
Experimental design
Five replicates of each plant species were planted into both non-inoculated and AM fungi inoculated soil treatments for a total of 320 plants. Because of the large variation in the germination rate of each plant species, plants were randomized within but not between species.
The soil was a 1:1:1 mixture of Indiana topsoil, river sand, and calcined clay. The soil mixture was steam sterilized twice for 4 hours with a one-day rest period in between sterilizations. The Indiana soil had a pH of 6.3, with 2.0% organic matter, 9 ppm Nitrate, 6 ppm P (colorimetric Bray), and 113 ppm K (ammonium cetate-ICP). Non-inoculated pots received 2000 cm3 of the soil mixture. The soil we used was collected near to the site of AM fungi and seed collection.
Seeds were cold moist stratified in steam sterilized sand for one month before being allowed to germinate in the Indiana University greenhouses during the summer of 2010. When plants were planted into their treatments, initial plant size was collected. Plants were grown two months before being washed and dried. The total above ground biomass was collected by cutting the stem at the soil line, and measuring the dry weight of stem and flower heads.
Methods 3.
Root Analyses
We analyzed the root architecture of each plant by scanning an image of two subsamples of each root. The number of root tips was then counted manually, after analyses using WinRhizo (WinRhizo 2005) failed to detect large portions of root segments in the scanned images. Each root subsample was then dried and weighed to calculate the number of root tips per gram of root, henceforth referred to as root tips per mass. Because WinRhizo failed to analyze our roots, the only data we could collect on these root subsamples was the number of root tips and total weight for each root sample image. Root tips per mass is an index of root fibrosity, as more tips indicates more root branching and finer roots per mass than roots with less tips per mass. Unless specified, we refer to the root tips per mass of the non-inoculated plants because these measurements are independent of fungal inoculation. A subsample of roots from each plant was washed and stained with Trypan Blue to confirm AM fungi colonization (McGonigle et al. 1990). The results are recorded as the arcsine transformed percentage of intercepted roots that are successfully colonized by AM fungi as scored at 200X in a compound microscope. All other roots were then dried for biomass measurements.
Methods 4. Construction and analyses using phylogenetic trees.
A phylogenic tree of our 30 plant species was made by searching for ITS1 and ITS2 regions in the GenBank database (Benson et al. 2013). A maximum likelihood tree was aligned using MEGA (Tamura K 2013). See Fig. A3 for our reconstructe phylogenetic tree. A phylogenetic multiple regression of mycorrhizal responsiveness was performed using our constructed tree with the caper package in R (Orme 2013). Predictors were BLUP means for average plant mass and root tips per mass.
Results 1.
Plant Growth and Root Architecture
Plant successional stage was the most important determinant of average plant growth rate (Table A2, F3,21 = 8.1, p = 0.009), with early successional species accumulating biomass faster than those from later successional stages (Table A2, F1,21=22.5, p=0.0001), providing internal confirmation of the successional classification of our plant species. The number of root tips per mass was also dependent on successional stage (Table A2, F3,21 = 4.8, p = 0.01), which was driven by a tendency for early successional plants to have more root tips per mass (Table A2, F1, 21 = 4.0, p = 0.06). Plant family was an important contributor to plant growth rate (Table A2, F5,21 = 4.4, p = 0.007) and the number of tips per mass (Table A2, F5,21 = 9.8, p < 0.0001). We found no significant effects on root to shoot ratio (Table A2).
Effects of AM fungi on Plant Biomass
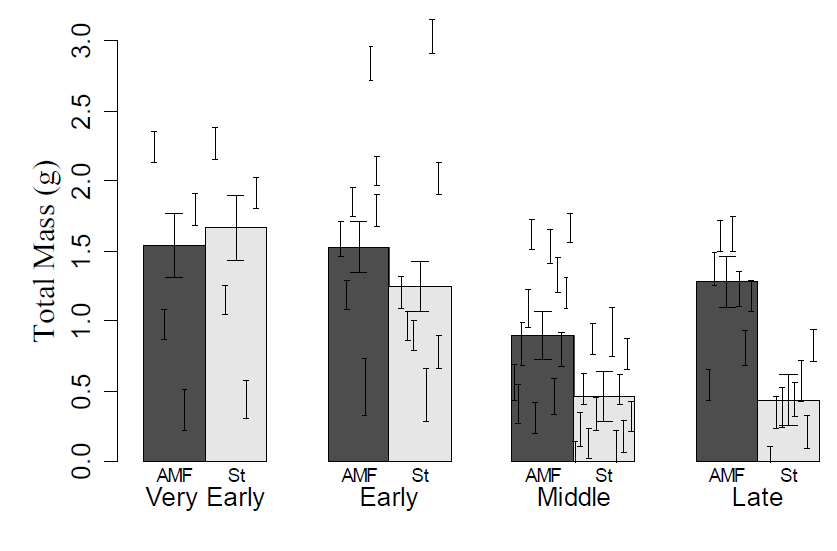
AM fungi generally increased plant biomass, with the exception of very early successional species, but the amount of increase varied greatly between plant species (Fig. A2, Table A2, F1,21 = 13.2, p = 0.002). Growth response to mycorrhizal fungi did not depend upon plant family (Table A2, F5,21 = 0.0, p = 0.5), but strongly depended on plant successional stage (Table A2, F3,21 = 4.9, p = 0.01). Biomass of early successional species was minimally affected by inoculation, while inoculation of plants from middle and late successional stages increased their biomass by 490% and 870%, respectively (Table A2, F1,21 = 12.1, p = 0.002). Inoculation did not significantly affect plant root architecture or root to shoot ratio (Table 1).
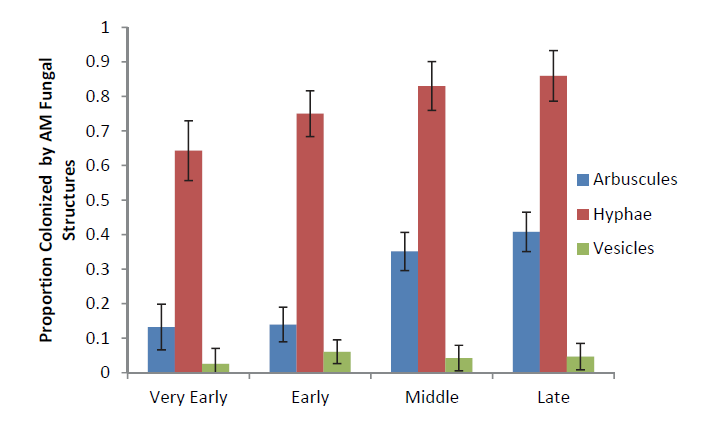
Fig. A1. Fungal colonization results for the proportion of roots colonized by AM fungal arbuscules, hyphae, and vesicles for each successional stage.
Fig. A2. The effects of successional stage and mycorrhizal fungi on plant growth. Large error bars represent variation between plant species in each successional stage, while small error bars represent the mean and variation of individual plant species within a given successional stage.
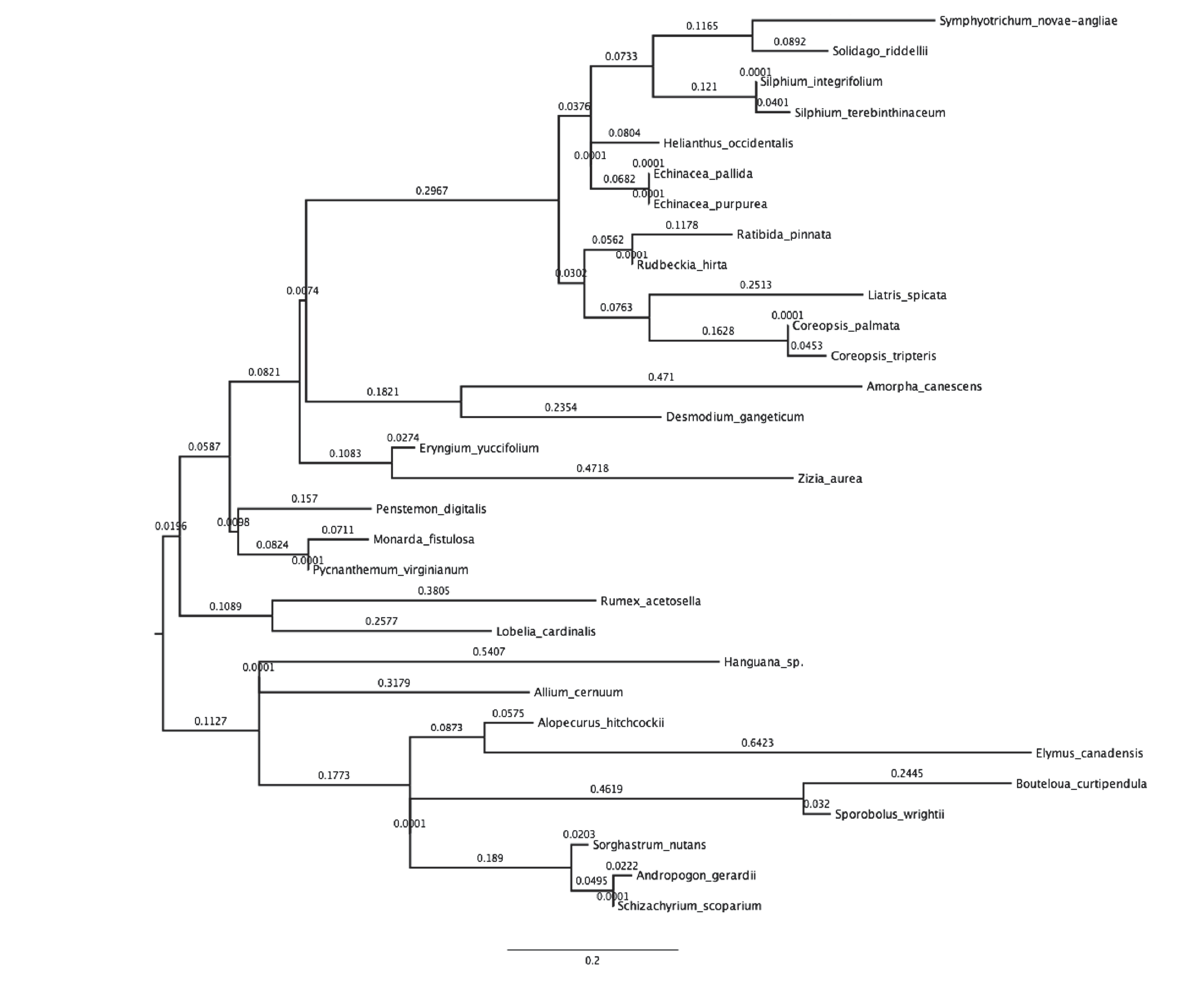
Fig. A3. Reconstruction of plant phylogeny for our 30 plant species based on ITS1 and ITS2 DNA markers.
Literature Cited
WinRhizo. 2005. WinRhizo, version 2005c. Regent Instruments. Saint-Foy, Quebec, Canada.