Ecological Archives E096-152-A2
Douglas A. Kelt, Jaclyn R. Aliperti, Peter L. Meserve, W. Bryan Milstead, M. Andrea Previtali, and Julio R. Gutiérrez. 2015. Energetic compensation is historically contingent and not supported for small mammals in South American or Asian deserts. Ecology 96:17021712. http://dx.doi.org/10.1890/14-1569.1
Appendix B. Results of analyses using a more liberal definition of potentially equivalent species.
Results of analyses using a more liberal definition of potentially equivalent (PE) species as all trophically similar species weighing less than 110% of the target species. Data provided here complement those provided in text for a more restricted definition of PE species (within 10% of body weight).
Table B1. Tests of the distribution of potentially equivalent (PE) species in North America, the Gobi Desert, and South America. Note that none of our sites in the Gobi or South American regions included any carnivorous PE species, and no South American sites included any granivorous PE species. D and Ka are the test statistics for the Kolmogorov-Smirnov test and the Kuiper test, respectfully. Tests were qualitatively identical if six South American sites lacking any species are removed from analysis. Because no South American sites exhibited any granivorous PE species (Table 2) we did not compare this trophic group against North America.
|
|
D (P) |
Ka (P) |
All Species |
NA vs. SA |
0.432 (<0.0001) |
3.684 (<0.0001) |
NA vs. Gobi |
1.000 (<0.001) |
8.089 (<0.0001) |
|
Carnivores |
NA vs. SA |
0.136 (0.178) |
1.099 (0.687) |
Folivores |
NA vs. SA |
0.517 (<0.0001) |
4.451 (<0.0001) |
NA vs. Gobi |
0.975 (<0.0001) |
7.887 (<0.0001) |
|
Granivores |
NA vs. Gobi |
0.975 (<0.0001) |
7.887 (<0.0001) |
Omnivores |
NA vs. SA |
0.910 (<0.0001) |
7.339 (<0.0001) |
NA vs. Gobi |
0.652 (<0.0001) |
5.272 (<0.0001) |
Table B2. Descriptive statistics for the distribution of potentially equivalent (PE) species in North America, the Gobi Desert, and South America, using the more liberal definition of PE species as any trophically similar species weighing less than 110% of the weight of the target species. “--"denotes the fact that no South American sites exhibited any granivorous PE species.
|
Mean |
Median |
||||
|
NA |
Gobi |
SA |
NA |
Gobi |
SA |
All Species |
43.050 |
0.577 |
32.927 |
44 |
0 |
28 |
Carnivores |
0.647 |
0 |
0.354 |
0 |
0 |
0 |
Folivores |
14.318 |
0.113 |
8.323 |
11 |
0 |
0 |
Granivores |
28.617 |
0.557 |
-- |
30 |
0 |
-- |
Omnivores |
9.358 |
0 |
24.250 |
14 |
0 |
26 |
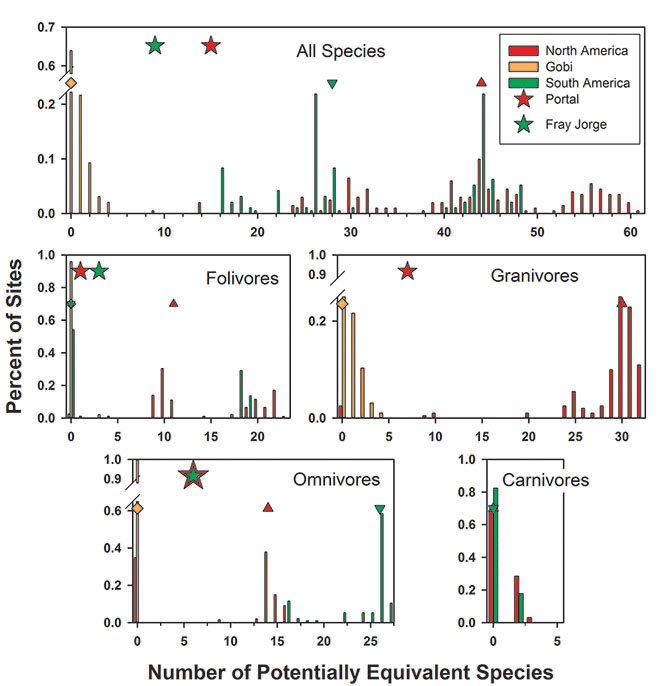
Fig. B1. Distribution of potentially equivalent (PE) species in three regions using a more liberal definition of PE species as any trophically similar species weighing less than 110% of the weight of the target species. Triangles represent the median values for each region. Stars indicate the number of potentially equivalent species at two focal sites. Note that the median number of carnivorous PE species was zero in both North and South America; the Gobi region lacked carnivorous PE species, and South American sites lacked any granivorous PE species (Table B2).