Ecological Archives E096-151-A1
Angela D. Luis, Richard J. Douglass, James N. Mills, and Ottar N. Bjørnstad. 2015. Environmental fluctuations lead to predictability in Sin Nombre hantavirus outbreaks. Ecology 96:1691–1701. http://dx.doi.org/10.1890/14-1910.1
Appendix A. Supplemental figures.
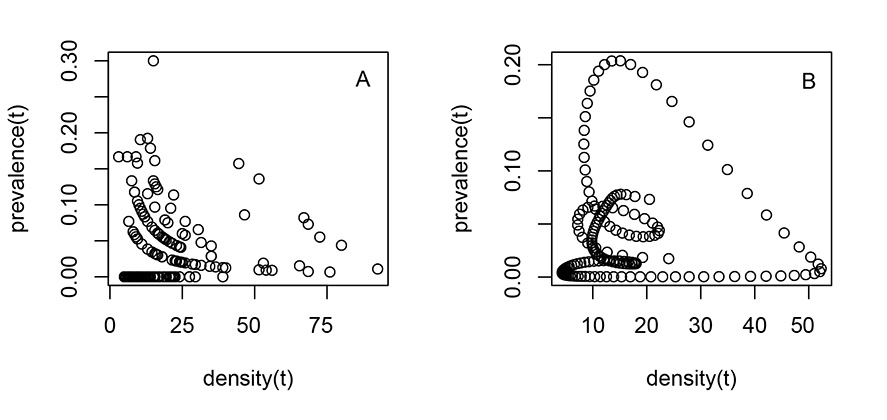
Fig. A1. Prevalence appears to be negatively correlated with current density in both (a) the data and (b) the model, although transmission is positively density dependent.
Fig. A2. The strongest correlation between density and prevalence at the Cascade field site by cross correlation function (CCF) is at a 16 month lag for both (a) the data and (b) the model.
Fig. A3. The prevalence of the virus (A; left axis) is determined by the equilibrium population size, N*, or K. As a result, the regulatory impact of the virus is a function of N*, shown here as the proportion of the disease free equilibrium population remaining in the presence of the disease (B; right axis).
Fig. A4. A comparison of the cross correlation function (CCF) of density and prevalence between the Cascade (A) and Polson (B) field sites. There was a dominant 16-month lag between a peak in density and a peak in prevalence at the Cascade site. However, there is a range of lags between density and prevalence that are overall shorter at the Polson site, because the density was consistently higher than at Cascade and there was more than one significant outbreak.
Fig. A5. Elasticities of the parameters— percent change in the lag time between a peak in density and a peak in prevalence when parameters values are increased by 5%.
Fig. A6. Likelihood profiles for several pairs of parameters, with the 95% confidence intervals in red.
Fig. A7. Out of sample validation for different transmission functions: (a) Density-dependent transmission, βSI (used in this study), (b) Frequency-dependent transmission, βSI/N (c) alternative functions: βSI/Nq and (d) βSI/(1-q+qN).
Fig. A8. Age structured captures at the Cascade site.