Ecological Archives E096-150-A1
Thomas L. Anderson and Howard H. Whiteman. 2015. Asymmetric effects of intra- and interspecific competition on a pond-breeding salamander. Ecology 96:16811690. http://dx.doi.org/10.1890/14-0479.1
Appendix A. Additional figures and tables of experimental design, model selection results, and parameter estimates.
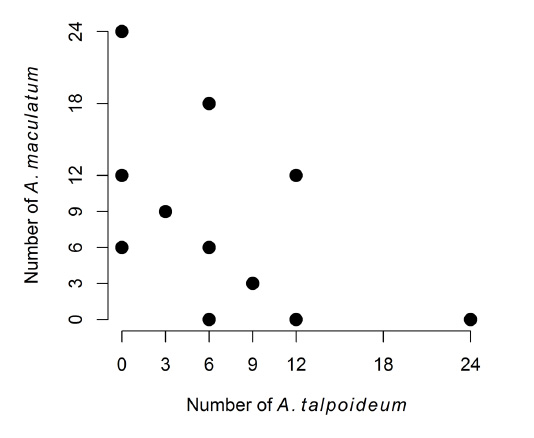
Fig. A1. Density combinations of the response surface design. All treatments had five replicates, except for the 12:0 and 6:0 (A. talpoideum: A. maculatum) treatments which had four replicates due to erroneous mixing of animals resulting in their exclusion from analyses.
Multinomial Regression Results
Table A1. Multinomial regression models that compared the production (# of individuals) of each phenotype in the mole salamander (Ambystoma talpoideum). "Spotted" refers to the spotted salamander
(A. maculatum). The metamorph phenotype was set as the reference level. ω is the AICc weight.
Model |
Covariates |
ΔAICc |
ω |
Additive |
Mole Density+Spotted Density |
0.0 |
0.76 |
Interactive |
Mole+Spotted+Mole:Spotted |
2.3 |
0.24 |
Overall |
Overall Density |
12.7 |
<0.001 |
Conspecific |
Mole Density |
38.4 |
<0.001 |
Spotted Date |
Mean Date of Spotted Metamorphosis |
132.3 |
<0.001 |
Spotted Survival |
Spotted Survival |
136.2 |
<0.001 |
Null |
Null (intercept only) |
136.7 |
<0.001 |
Heterospecific |
Spotted Density |
139.9 |
<0.001 |
Table A2. Parameter estimates, standard error and 95% confidence intervals (lower and upper) from the top model of the multinomial regression (Model 1 in Table A1), which included terms of the initial abundance of mole (Ambystoma talpoideum; "Mole") and spotted salamanders (A. maculatum; "Spotted"). The metamorph phenotype was set as a reference level.
Covariate |
Estimate |
SE |
lower |
upper |
larva(intercept) |
-3.68 |
0.54 |
-4.74 |
-2.62 |
paedomorph (intercept) |
1.10 |
0.46 |
0.2 |
2.01 |
larva:Mole |
0.19 |
0.03 |
0.14 |
0.24 |
paedomorph:Mole |
-0.19 |
0.04 |
-0.27 |
-0.11 |
larva:Spotted |
0.15 |
0.03 |
0.09 |
0.21 |
paedomorph:Spotted |
-0.05 |
0.03 |
-0.11 |
0.01 |
Table A3. Model selection results comparing the Linear, Ricker, and Exponential competition models for body size of the three phenotypes of mole salamanders (Ambystoma talpoideum). *Ricker would not converge. ω is the AICc weight.
Phenotype |
Model |
ΔAICc |
df |
ω |
Metamorph |
Linear |
0 |
10 |
1 |
|
Exponential |
28.7 |
10 |
<0.001 |
|
Ricker |
188.2 |
10 |
<0.001 |
OW Larvae |
Linear |
0 |
10 |
1 |
|
Exponential |
129.7 |
10 |
<0.001 |
|
Ricker |
320.2 |
10 |
<0.001 |
Paedomorph* |
Linear |
0 |
10 |
0.9005 |
|
Exponential |
4.4 |
10 |
0.0995 |
Inividual Growth Rate Results
Table A4. Model selection results for growth rates of individually marked larvae of mole salamanders (Ambystoma talpoideum).
Model |
ΔAICc |
ω |
Michaelis-Menten |
0.0 |
1.0 |
Power Law |
237.1 |
<0.001 |
Gompertz |
475.2 |
<0.001 |
Table A5. Parameter estimates for individual growth rates of each phenotype (metamorph, paedomorph, and overwintered (OW) larvae) of mole salamanders (Ambystoma talpoideum). Abundance is the initial number of A. talpoideum. a is the asymptote, b is the half-maximum scale parameter, and b*a-1 is the initial slope. The lower and upper CI are 95% confidence intervals. "n" is the total sample size (number of individuals from all tanks with that density).
a |
b |
b*a-1 |
|||||||
Phenotype |
Initial tank |
n |
lower CI |
estimate |
upper CI |
lower CI |
estimate |
upper CI |
estimate |
Metamorph |
3 |
5 |
52.61 |
57.46 |
62.30 |
35.94 |
45.51 |
55.07 |
0.79 |
|
6 |
19 |
41.19 |
51.44 |
61.69 |
12.88 |
33.07 |
53.27 |
0.64 |
|
9 |
10 |
33.45 |
43.79 |
54.14 |
4.29 |
24.76 |
45.22 |
0.57 |
|
12 |
15 |
41.11 |
51.42 |
61.73 |
18.25 |
38.71 |
59.18 |
0.75 |
|
18 |
6 |
36.52 |
47.55 |
58.58 |
15.44 |
37.98 |
60.51 |
0.80 |
|
24 |
6 |
34.12 |
45.36 |
56.61 |
12.41 |
35.30 |
58.19 |
0.78 |
OW Larva |
6 |
5 |
48.64 |
53.11 |
57.58 |
31.24 |
39.11 |
46.98 |
0.74 |
|
12 |
6 |
32.26 |
42.75 |
53.24 |
7.12 |
25.52 |
43.91 |
0.60 |
|
18 |
3 |
31.71 |
42.85 |
54.00 |
9.78 |
29.48 |
49.17 |
0.69 |
|
24 |
7 |
26.97 |
37.26 |
47.55 |
1.55 |
19.68 |
37.81 |
0.53 |
Paedomorph |
3 |
5 |
62.09 |
69.13 |
76.17 |
45.81 |
56.79 |
67.76 |
0.82 |
|
6 |
5 |
37.72 |
54.61 |
71.50 |
10.04 |
36.05 |
62.06 |
0.66 |
|
12 |
4 |
39.09 |
56.58 |
74.06 |
15.85 |
43.20 |
70.54 |
0.76 |