Ecological Archives E096-145-A1
Brian S. Evans, Thomas B. Ryder, Robert Reitsma, Allen H. Hurlbert, and Peter P. Marra. 2015. Characterizing avian survival along a rural-to-urban land use gradient. Ecology 96:16311640. http://dx.doi.org/10.1890/14-0171.1
Appendix A. Supplementary information about the distribution, selection, and proportional land cover of study sites and data on mark–recapture rates of the seven study species along the rural to urban gradient in greater Washington, D.C., USA.
A.1 Species Relative Abundance and Mark–Recapture Rates
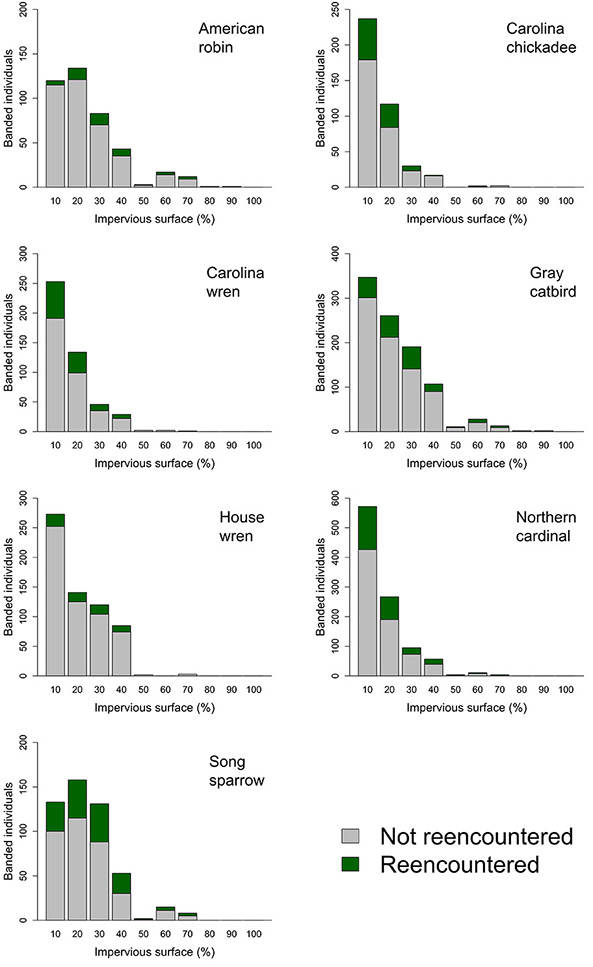
We directly evaluated whether a lack of captures for a given species was the result of sampling bias (i.e., fewer sites at the upper end of the rural-to-urban gradient) or lower abundance (i.e., reduced capture rates for that species). To do so, we calculated the number of observations of a species within a moving window across the impervious surface gradient proportional to the number of sites within that window (bin width = 5%, step = 1%). We then calculated OLS regression models between log-transformed proportional capture and impervious cover data. We found no relationship between impervious surface and proportional captures for Gray catbird (p value = 0.718, adjusted R² = -0.01) or Song sparrow (p value = 0.195, adjusted R² = 0.01). American robin exhibited a positive relationship between proportional captures and impervious surface (slope = 0.04, p value = 0.002) however the model was poorly fit to the data (adjusted R² = 0.11). The proportional captures for the remaining species declined with increasing impervious surface cover (Carolina chickadee: slope = -0.09, p value < 0.001, adjusted R² = 0.87; Carolina wren: slope = -0.10, p value < 0.001, adjusted R² = 0.88; House wren: slope = -0.10, p value < 0.001, adjusted R² = 0.43; Northern cardinal: slope = -0.15, p value < 0.001, adjusted R² = 0.80). These results provide supportive evidence that a lack of captures of these species at the upper end of the urbanization gradient is related to a low number of captures at this portion of the urban gradient rather than limitations associated with the number of sites.
Table A1. A comparison between sites sampled as part of Neighborhood Nestwatch and randomly selected sites within the study regions showed no significant differences in the proportion of three of four land cover types.
Habitat |
Sites Sampled (n = 242) |
Sites Random (n = 242) |
K-Sa |
P |
|
Proportional Land Cover (%) |
|
|
|
Core Urban |
10.4 ± 1.2 |
11.6 ± 1.2 |
0.09 |
0.27 |
Suburban |
39.7 ± 1.7 |
30.5 ± 1.6 |
0.18 |
0.001 |
Forested |
24.5 ± 1.2 |
28.2 ± 1.5 |
0.10 |
0.22 |
Agricultural |
17.2 ± 1.4 |
22.3 ± 1.6 |
0.11 |
0.12 |
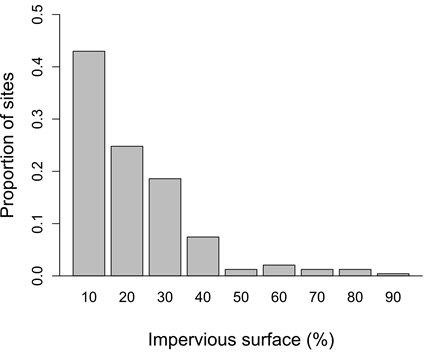
Fig. A1. The proportion of Neighborhood Nestwatch sites sampled at varying degrees of urbanization to estimate annual adult survival for seven species of birds in greater Washington, DC.
Fig. A2. Sample size of birds captured across the rural-to-urban gradient including the counts of individuals that were captured but never reencountered, reencountered at Neighborhood Nestwatch sites in which citizen scientist participants report resight data, and sites in which only Nestwatch technicians conduct resighting.
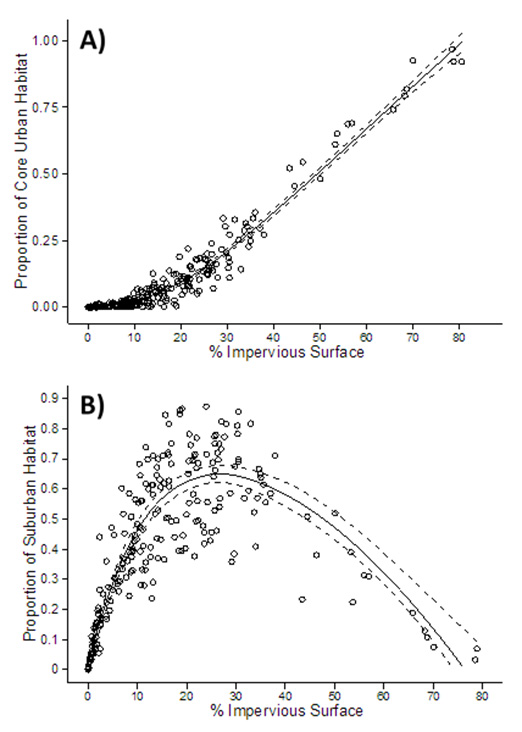
Fig. A3. The relationship between impervious surface and (A) proportion of core urban and (B) suburban habitat as measured at Neighborhood Nestwatch sites suggest that this metric is a good proxy for the urbanization gradient in greater Washington, DC.