Ecological Archives E096-141-A2
Edward J. Raynor, Anthony Joern, and John M. Briggs. 2015. Bison foraging responds to fire frequency in nutritionally heterogeneous grassland. Ecology 96:15861597. http://dx.doi.org/10.1890/14-2027.1
Appendix B. Supplementary methods and results: non-fire related foraging behavior and recent grazing activity index at Konza Prairie Biological Station, Manhattan, Kansas, USA 20122013.
Functional Responses to Feeding Station Live Biomass
Bite mass
To test whether this trend between bite mass and available forage was observed in relation to live tissue availability by seasonal period we conducted ANCOVA with live grass mass. In all three treatments, a significant interaction between season and live grass mass did not occur in the bite mass ANCOVA (P > 0.1); therefore we did not test whether the slope of bite mass with increasing live grass mass differed between seasons.
Bite rate
In frequently- and not-burned watersheds, a significant interaction between season and live grass mass did not occur in the bite rate ANCOVA (P>0.1); therefore we did not test whether the slope of bite rate with increasing live grass mass differed between seasons in these treatment types. A marginally significant interaction between season and live grass mass did occur for bite rate (slope, F1, 50 = 3.48, P=0.07, intercept, F1,50 = 3.92, P = 0.05) in infrequently-burned watersheds with transitional season bite rate decreasing at a greater rate than the growing season.
Intake rate
In frequently- and not-burned watersheds, a significant interaction between season and live grass mass did not occur in the intake rate ANCOVA (P>0.1); therefore we did not test whether the slope of intake rate with increasing live grass mass differed between seasons in these treatment types. A significant interaction between season and live grass mass did occur for bite rate (slope, F1, 50 = 5.5, P=0.02, intercept, F1,50 = 1.2, P = 0.28) in infrequently-burned watersheds with transitional season intake rate decreasing at a greater rate than the growing season.
Overall, we found significant differences in slopes of seasonal bite rate and intake rate with increasing total grass mass and live grass mass with transitional season rates decreasing at a greater rate than the growing season only in infrequently-burned watersheds.
Seasonal Trends in Feeding Measures
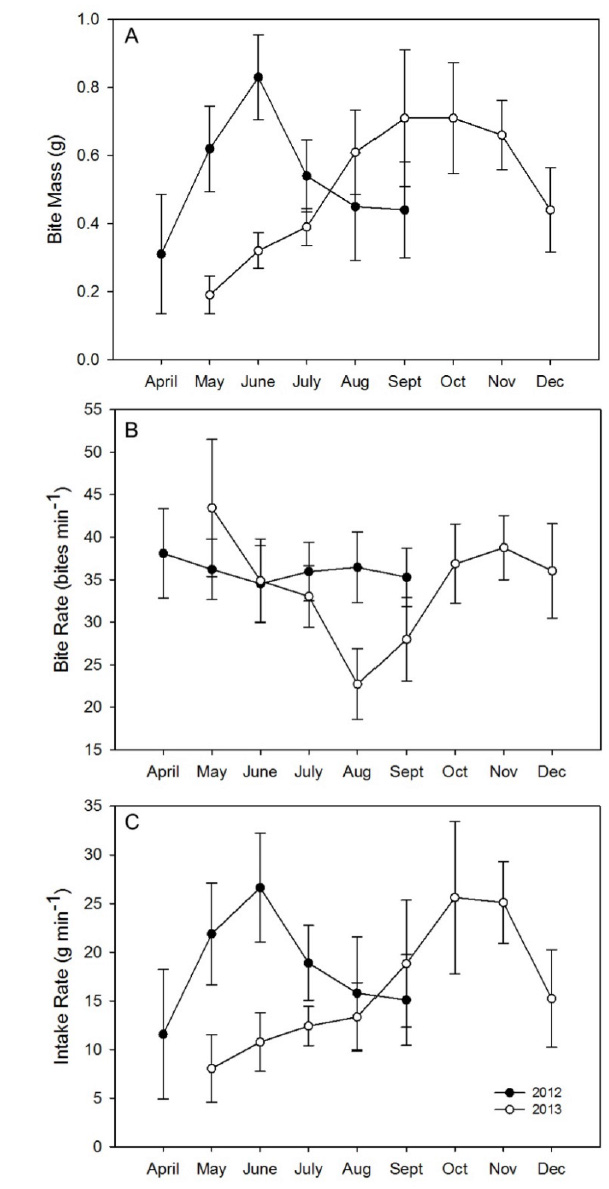
Mean bite mass increased with increasing grass biomass during spring in both years with an increase from 0.30 to 0.85 g in 2012 and from 0.20 to 0.40 g in 2013 averaged across all three burn types (Fig. B1a). Thereafter, mean bite mass decreased to 0.45 g in 2012, whereas in 2013 it rose to 0.71 g until October. Mean bite rate remained between 33 and 38 bites min-1 from April to July in both years (Fig. B1b). Thereafter, mean bite rate remained at ~35 bites min-1 in 2012, whereas in 2013 it decreased to 22 bites min-1 in August then rose to ~38 bites min-1.
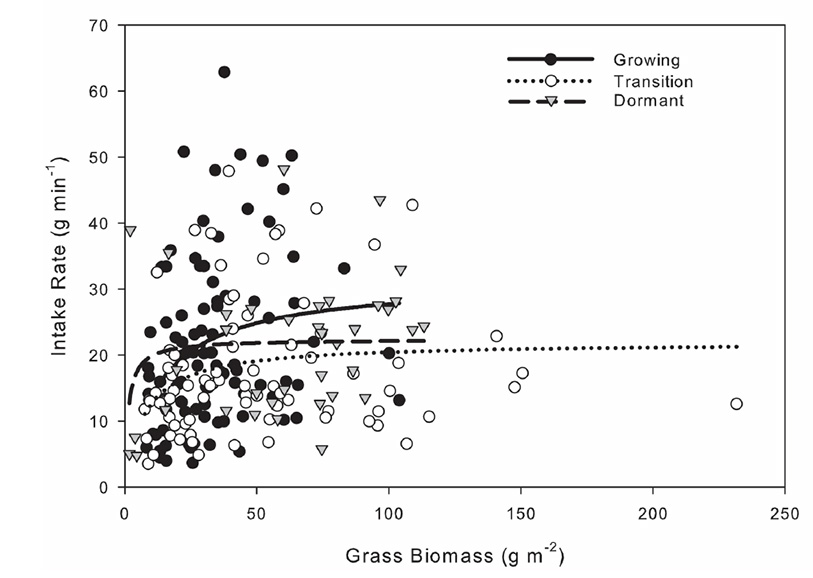
The mean grass intake averaged across burn types increased during spring in both years from 12 g min-1 to 27 g min-1 in 2012 and from 8 to 11 g min-1 in 2013. Thereafter, grass intake rate decreased to 15 g min-1 in 2012, whereas in 2013 it rose to 26 g min-1 during the transitional months of September and October (Fig. B1c). In 2013, the larger mean bite mass made possible by the generally more productive growing season led to an increase in the mean grass intake rate to over 19 g min-1 from September to November. Overall grass intake rate increased with grass biomass toward an asymptote of 31.4, 21.9, and 22.4 g min-1 during the growing (F1, 90=9.2, P=0.003), transitional (F1,77=5.93, P=0.017), and dormant seasons, respectively (F1,35=4.9, P=0.03) (Fig. B2).
Nutrient intake rate was calculated by multiplying mean nutrient concentrations of feeding station forage by the estimated food intake rate. In 2012, intake rate of both crude protein and P peaked during late spring (May–June), while these rates remained constant in 2013 from May to August (Fig. B3). Rates of nutrient gain in 2013 were less than half those attained at the start of growing season in 2012.
Fig. B1. Monthly changes (±SE) in (a) mean bite mass; (b) mean bite rate; (c) mean intake rate by plains bison in 2012–2013 at Konza Prairie Biological Station, Manhattan, Kansas, USA.
Fig. B2. Nonlinear relation between overall bison intake rate and feeding station biomass during the growing (April to mid-July), transitional (mid-July to early October), and dormant (mid-October to late March) seasons at Konza Prairie Biological Station, Manhattan, Kansas, USA.
Multivariate Methods
Redundancy Analysis (RDA) was used to represent vegetation characteristics as a linear function of foraging behavior during the early growing season(April-June) and late summer (15 Aug–Oct) pooled across years; these periods reflect grass developmental and early-senescence periods when variation in grass quality is most pronounced. Values of the vegetation characteristic data set were centered and standardized using z-transformation. Permutation tests were used to test the significance of the relationships between vegetation characteristics and foraging behavior variables (Ter Braak 1995). Canonical ordination analyses were performed using function rda in the labdsv package for Program R (v2.15).
Associations between vegetation characteristics and the foraging behavior variables were deduced from the RDA biplot. In RDA, response and explanatory variables are represented as vectors in a multidimensional space and the relative positions of these vectors indicate correlations (Makarenkov and Legendre 2002, Borcard et al. 2011). The ordination biplot reduced the multi-dimensional space to the two most differentiating dimensions. When the angle between the vectors of vegetation characteristics and foraging behavior variables in the horizontal plane was <45° and >135°, we inferred that variables were positively and negatively correlated, respectively. No correlation between variables was inferred when the enclosed angle lay between 45° and 135°. Significant factors were identified by a stepwise forward selection procedure.
Results
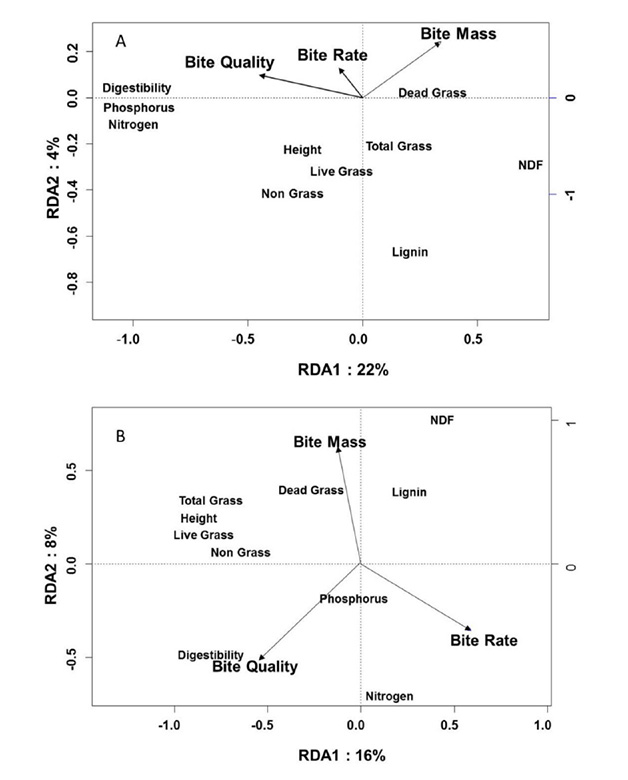
In spring, bite mass and bite quality averaged across years were associated with grass structure and grass chemistry, respectively (RDA, Fig. B4a). Bite mass was negatively associated with grass structure, while bite quality was positively associated with grass nutrient content. Bite mass (P=0.01) and bite quality (P=0.01) were significantly correlated with forage nutrient concentrations and physical structure (Monte Carlo Permutation test), but bite rate was not significant (P=0.46) nor was it associated with bite mass or bite quality (Table B1). In late summer, bite mass, bite quality, and bite rate were associated with various measures of vegetation structure and grass foliar chemistry (RDA, Fig. B4b). The vectors representing bite mass and bite rate pointed to opposite quadrants of the RDA biplot, suggesting an inverse relationship between these variables and vegetation structure (Table B1). Bite quality was positively associated with grass nutrient contents. Bite mass (P=0.01), bite quality (P=0.01), and bite rate (P=0.01) were significantly correlated with vegetation nutrients and structure (Monte Carlo permutation test).
Table B1. List of vegetation characteristics likely to be correlated with bite size and with bite quality as indicated by the spring and late summer RDA biplots (Fig.B4a, B4b) and the directions of the indicated correlation at Konza Prairie Biological Station, Manhattan, Kansas, USA.
Bite Mass |
|
Bite Quality |
|
Bite Rate |
||||||
|
Spring |
Late Summer |
|
|
Spring |
Late Summer |
|
|
Spring |
Late Summer |
Vegetation characteristic |
Direction of correlation |
|
Vegetation characteristic |
Direction of correlation |
|
Vegetation characteristic |
Direction of correlation |
|||
Total grass mass |
- |
+ |
|
Grass digestibility |
+ |
+ |
|
Total grass mass |
- |
- |
Live grass |
- |
+ |
|
%N |
+ |
+ |
|
Live grass |
- |
- |
Dead grass |
+ |
+ |
|
%P |
+ |
+ |
|
Dead grass |
- |
- |
Height |
- |
+ |
|
%NDF |
- |
- |
|
Height |
- |
- |
No-grass mass |
- |
+ |
|
Lignin |
- |
- |
|
No-grass mass |
- |
- |
%NDF |
|
+ |
|
Total grass mass |
- |
|
|
%N |
|
+ |
Lignin |
|
+ |
|
|
|
|
|
%NDF |
- |
|
Fig. B3. (A) RDA biplot showing the relationship between foraging behavior variables and vegetation characteristics for bison grazing at Konza Prairie during the spring season (1 April to 20 June) pooled across years. Of the total variance in vegetation characteristics, 26% could be explained by foraging behavior variables. Of this variance, 22% is explained by the horizontal axis (axis 1 of the RDA), and another 4% by the vertical axis (axis 2). (B) RDA biplot showing the relationship between foraging behavior variables and vegetation characteristics for bison grazing during the late summer season (1 August to 7 October) pooled across years. Of the total variance in vegetation characteristics, 24% could be explained by foraging behavior variables of which 16% is explained by axis 1 and another 8% by axis 2. Arrows indicate positions of foraging behavior variables.
Grazing Index
Grazing Activity Methods
An index of recent grazing activity established by Joern (2005) was used at forage sampling sites to estimate recent bison grazing. Joern (2005) classified an index of recent grazing activity based on an ordinal scale: 0 (ungrazed sites; no evidence of recent grazing because bison never present); 1 (no recent grazing but site located in grazed area); 2 (small amount of grazing evident, probably by one or two animals); 3 (moderate grazing from many animals; many grazed patches interspersed in ungrazed matrix, and evidence of relatively fresh dung); 4 (extensive grazing, but grazing lawn not yet developed; evidence of large herd grazing activity, including recent dung); and 5 (extensive grazing with much return grazing leaving a closely cropped site and little vertical structure).
Results
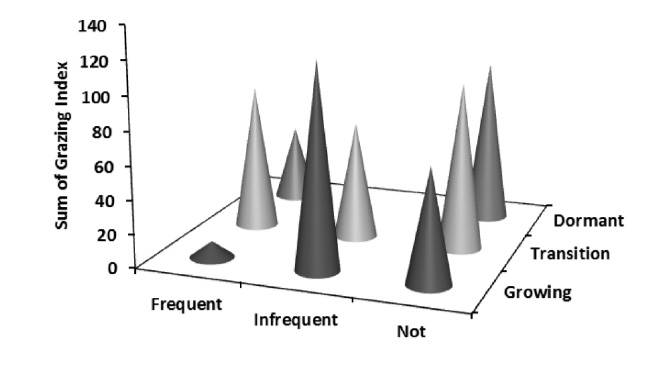
Mean grazing index for burn treatments were not different (p = 0.53), while mean grazing index differed between seasons (p = 0.001) with growing season having a lower index than the dormant season but not transitional period. A significant interaction (p = 0.01) between burn frequency and season revealed not-burned watersheds in the growing season had a lower index than in the dormant season. Sum of grazing index per sampling event indicate feeding stations in infrequently burned watersheds had the greatest grazing activity during the growing season (Fig. B5).
Fig.B5. Sum of grazing index across season and burn treatments pooled from all feeding station sampling events from 2012–2013 at Konza Prairie Biological Station, Manhattan, Kansas, USA.
Literature cited
Borcard, D., F. Gillet, and P. Legendre. 2011. Numerical ecology with R. Springer, New York, New York, USA.
Joern, A. 2005. Disturbance by fire and bison grazing modulate grasshopper assemblages in tallgrass prairie. Ecology 86:861–873.
Makarenkov, V., and P. Legendre. 2002. Nonlinear redundancy analysis and canonical correspondence analysis based on polynomial regression. Ecology 83:1146–1161.
Ter Braak, C. J. F. 1995. Ordination. Pages 91–173 in R. G. H. Jongman, C. J. F. Ter Braak, and O. F. R. Van Tongeren, editors. Data analysis in community and landscape ecology. Cambridge University Press, Cambridge, UK.