Ecological Archives E096-141-A1
Edward J. Raynor, Anthony Joern, and John M. Briggs. 2015. Bison foraging responds to fire frequency in nutritionally heterogeneous grassland. Ecology 96:15861597. http://dx.doi.org/10.1890/14-2027.1
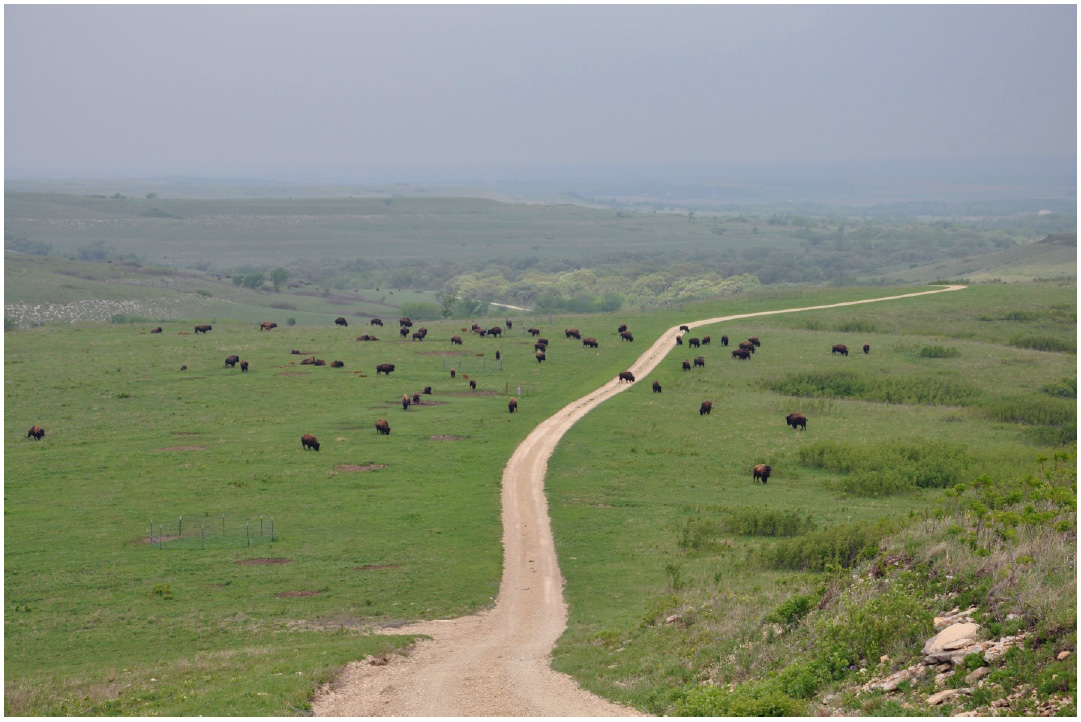
Appendix A. Supplementary study site information, including photograph of study area and detailed description of forage resource availability methodology and results for Konza Prairie Biological Station, near Manhattan, Kansas, USA.
Fig. A1. Landscape and vegetation in the Konza Prairie bison enclosure. Photo credit: E. Raynor.
Temporal Variation in Grassland-type Biomass
To measure variation in monthly vegetation biomass and height over the course of this two year study, permanent sampling stations were established in the lowland and upland areas of all bison-grazed watersheds. Six swaths of 0.1 × 1 m of vegetation were clipped in both upland and lowland topographical areas. To avoid resampling recent plots, each new sample was located randomly approximately 5 m from samples taken the previous month. Twenty grass canopy height measurements were made along a 30 m transect running parallel to the clipped vegetation swath. Clipped samples were sorted into graminoids, forbs, and litter and each fraction dried and weighed. Vegetation biomass and grass height measurements were collected every two months during the non-growing season. For grazed watersheds, two of the six 0.1 × 1 m graminoid samples were randomly selected for nutrient analysis.
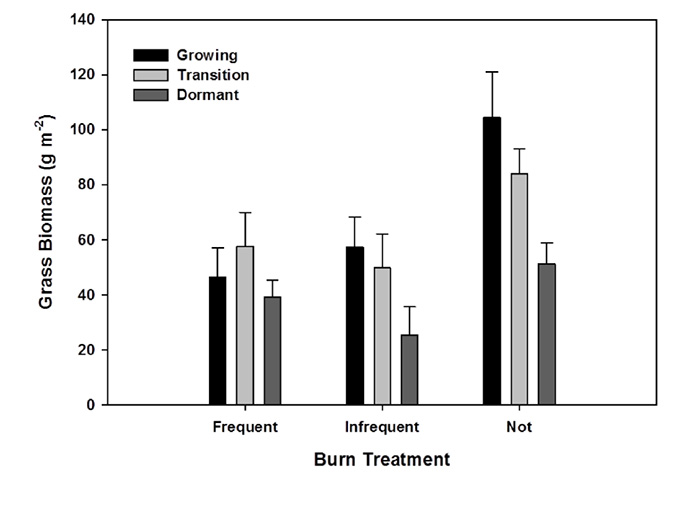
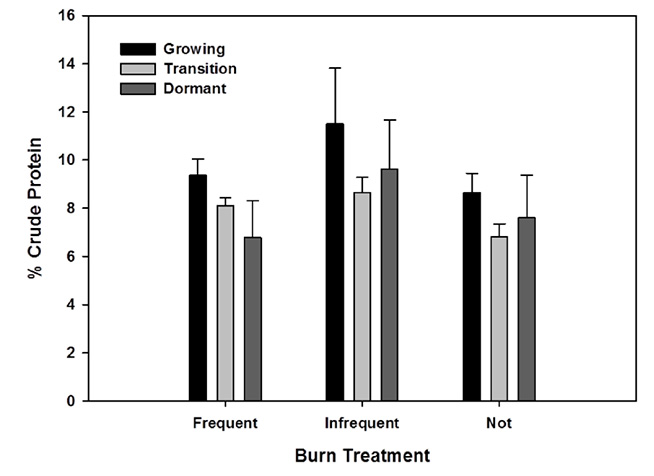
Table A1. Results from a mixed linear model ANOVA for the effects of seasonal period, burn frequency, and year on total grass biomass as well crude protein content of grass shoots at Konza Prairie Biological Station, 2012–2013.
|
|
|
Grass |
|
Crude Protein |
|
Effect |
df |
F |
P |
df |
F |
P |
Season |
2, 7.5 |
7.54 |
0.02 |
2, 6.7 |
0.44 |
0.65 |
Burn Frequency |
2, 22.7 |
8.11 |
0.002 |
2, 21.1 |
3.43 |
0.05 |
Season*Burn Frequency |
4, 22.6 |
0.83 |
0.52 |
4, 21.2 |
0.18 |
0.94 |
Year |
1, 22.2 |
0.07 |
0.78 |
1, 9.8 |
0.16 |
0.70 |
Season*Year |
2, 25.0 |
4.25 |
0.02 |
2, 12.1 |
3.67 |
0.06 |
Burn Frequency*Year |
2, 22.7 |
3.41 |
0.05 |
2, 21.1 |
0.64 |
0.53 |
Season*Burn Frequency*Year |
4, 22.6 |
0.30 |
0.87 |
4, 21.2 |
0.23 |
0.91 |
Fig. A2. Mean grass biomass (±SE) from grazed, permanent sampling stations pooled across 2012–2013 for each burn treatment by seasonal period inside the bison enclosure at Konza Prairie Biological Station, Manhattan, Kansas, USA.
Fig. A3. Crude protein content of grass leaf tissue from grazed, permanent sampling stations pooled across 2012–2013 for each for each burn treatment by seasonal period in the bison enclosure at Konza Prairie Biological Station, Manhattan, Kansas, USA.