Ecological Archives E096-132-A1
Heather M. Cayton, Nick L. Haddad, Kevin Gross, Sarah E. Diamond, and Leslie Ries. 2015. Do growing degree days predict phenology across butterfly species? Ecology 96:14731479. http://dx.doi.org/10.1890/15-0131.1
Appendix A. Time series analysis to determine the forecasting ability of growing degree days.
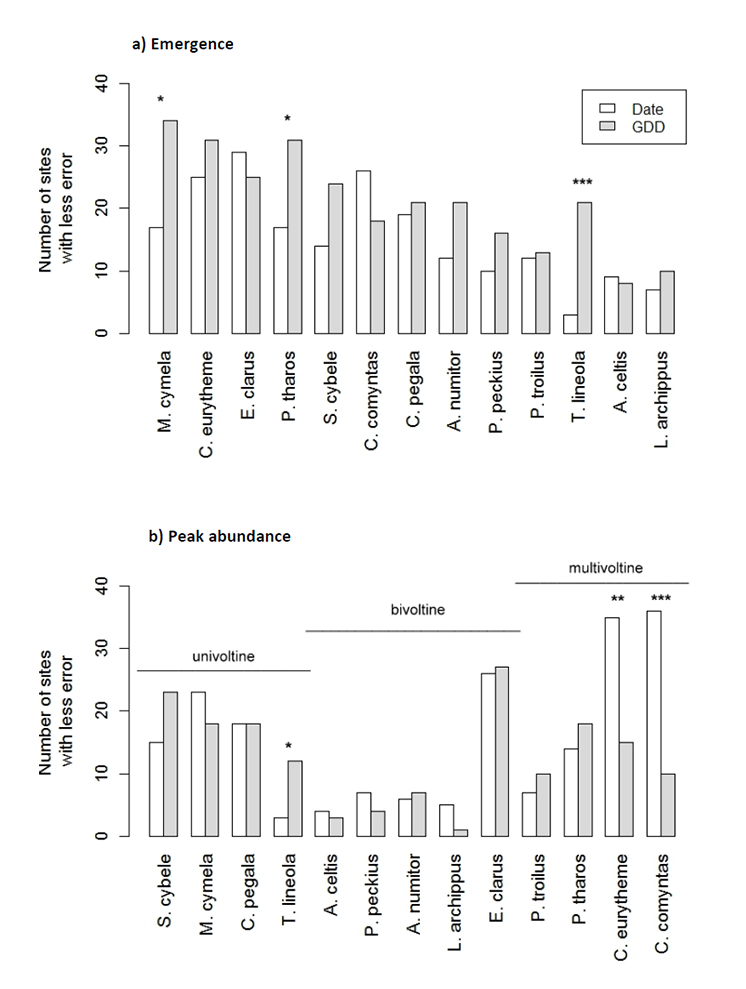
To quantify the ability of GDD and date as predictive tools, we performed a time series analysis using all site-by-year combinations that included at least three years of observations from each site. We excluded the final year of observation from each site for each species and used an autoregressive integrated moving average (ARIMA) model (Box and Jenkins 1976) to predict the GDD or date of emergence and peak in the final year. For each site analyzed we used results from the best fit ARIMA model according to AIC value. We then recorded the absolute difference between each observed value and predicted value, which we considered to be the amount of error associated with that variable. Predicted values for GDD were converted back to a date specific to each site and year, so that we were able to calculate the difference between predicted value and observed value of GDD on the same scale as ordinal date. Finally, for each site, we tallied whether date or GDD did better (i.e., had less error). To determine whether the number of sites with less error associated with GDD compared to date was significantly different for each species, we performed a chi-squared test (df = 1). We used package forecast in program R to conduct the analysis (R Development Core Team 2015). We used 3,405 emergence dates to predict future emergence across 81 sites, and we used 1,941 peak dates to predict future peak abundance across 76 sites. It was not possible to use all sites for all species. GDD did better than date at predicting emergence for all but three species, and did significantly better for three species (M. cymela, P. tharos, and T. lineola) (Table A1, Fig. A1a). GDD did better than date at predicting peak abundance for six species, and was equally good for one species (Table A1, Fig. A1b). GDD did significantly better at predicting peak abundance than date for T. lineola, a univoltine species, although date did significantly better than GDD for C. eurytheme, and C. comyntas, both multivoltine species.
Table A1. Number of sites for 13 butterfly species for which GDD or date had less error, or for which they were equal, when used to predict the final year of data at the site. Total number of sites is not equal for emergence and peak abundance within a species because it was not always possible at every site to forecast both emergence and peak.
Species |
First Emergence |
|
Peak abundance |
|||||
|
# Sites with less error |
# Sites with equal error |
|
# Sites with less error |
# Sites with equal error |
|
||
|
Date |
GDD |
|
p-value |
Date |
GDD |
|
p-value |
M. cymela |
17 |
34 |
4 |
0.017 |
23 |
18 |
3 |
0.435 |
C. eurytheme |
25 |
31 |
5 |
0.423 |
35 |
15 |
1 |
0.005 |
E. clarus |
29 |
25 |
3 |
0.586 |
26 |
27 |
1 |
0.890 |
P. tharos |
17 |
31 |
10 |
0.043 |
14 |
18 |
3 |
0.480 |
S. cybele |
14 |
24 |
8 |
0.105 |
15 |
23 |
2 |
0.194 |
C. comyntas |
26 |
18 |
7 |
0.228 |
36 |
10 |
1 |
<0.001 |
C. pegala |
19 |
21 |
6 |
0.752 |
18 |
18 |
1 |
1.000 |
A. numitor |
12 |
21 |
5 |
0.117 |
6 |
7 |
2 |
0.781 |
P. peckius |
10 |
16 |
8 |
0.240 |
7 |
4 |
2 |
0.366 |
P. troilus |
12 |
13 |
1 |
0.841 |
7 |
10 |
0 |
0.467 |
T. lineola |
3 |
21 |
2 |
<0.001 |
3 |
12 |
1 |
0.020 |
A. celtis |
9 |
8 |
2 |
0.808 |
4 |
3 |
1 |
0.705 |
L. archippus |
7 |
10 |
2 |
0.467 |
5 |
1 |
0 |
0.221 |
Fig. A1. Number of sites with less error associated with either GDD or date for predicting (a) emergence and (b) peak abundance for 13 butterfly species.
Literature Cited
Box, G. E., and G. M. Jenkins. 1976. Time series analysis: forecasting and control. Holden-Day.
R Development Core Team. 2015. R: A language and environment for statistical computing. R Foundation for Statistical Computing, Vienna, Austria.