Ecological Archives E096-130-A2
Carly J. Stevens, Eric M. Lind, Yann Hautier, W. Stanley Harpole, Elizabeth T. Borer, Sarah Hobbie, Eric W. Seabloom, Laura Ladwig, Jonathan D. Bakker, Chengjin Chu, Scott Collins, Kendi F. Davies, Jennifer Firn, Helmut Hillebrand, Kimberly J. La Pierre, Andrew MacDougall, Brett Melbourne, Rebecca L. McCulley, John Morgan, John L. Orrock, Suzanne M. Prober, Anita C. Risch, Martin Schuetz, and Peter D. Wragg. 2015. Anthropogenic nitrogen deposition predicts local grassland primary production worldwide. Ecology 96:14591465. http://dx.doi.org/10.1890/14-1902.1
Appendix B. Anthropogenic nitrogen deposition predicts local grassland primary production worldwide: Site information and expanded results.
Contents:
Table B1. List of site locations, along with mean climatic and plot variables.
Table B2. Coefficient of variation of variables used to predict ANPP (variables were standardized in analysis). CV is defied as 100*SD/Mean where SD is the standard deviation.
Fig. B1. Posterior predictive model checking and Bayesian p value of best hierarchical regression model.
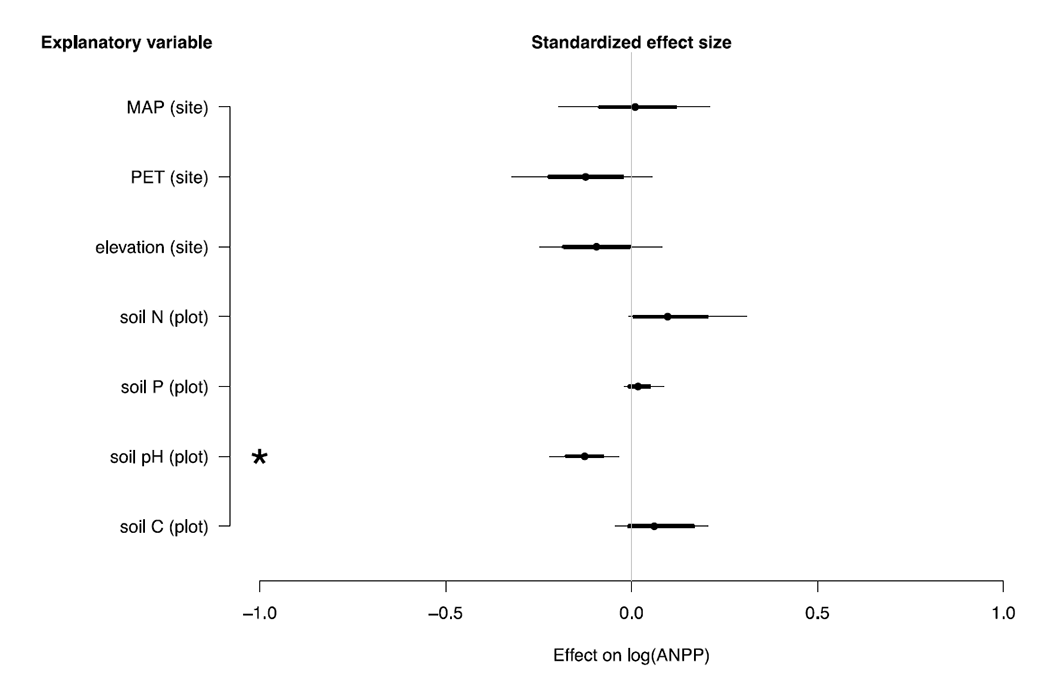
Fig. B2. Parameter estimates for model explaining ANPP without N deposition.
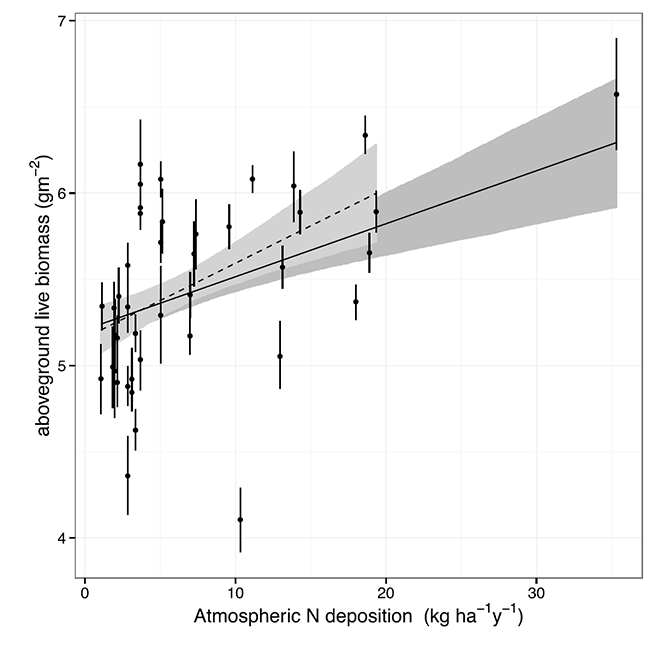
Fig. B3. Modeled relationship of N deposition and ANPP with and without the highest N deposition site
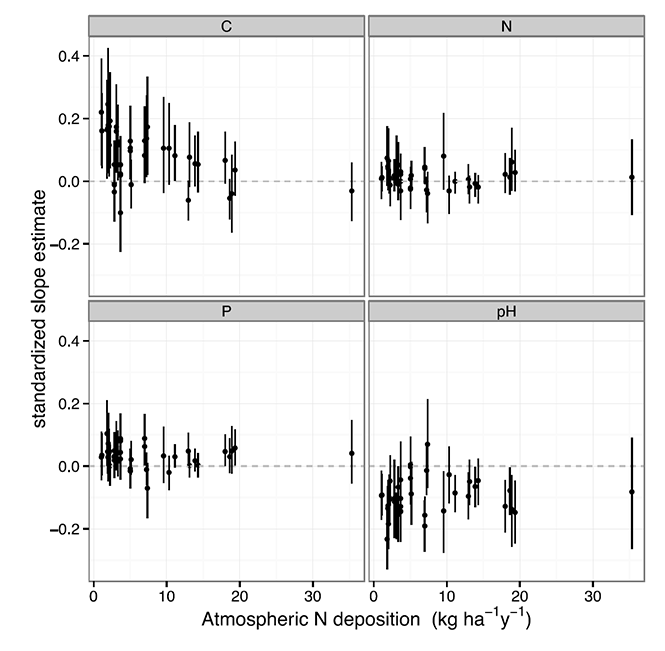
Fig. B4. Interactions between N deposition and plot-level soil-ANPP relationships.
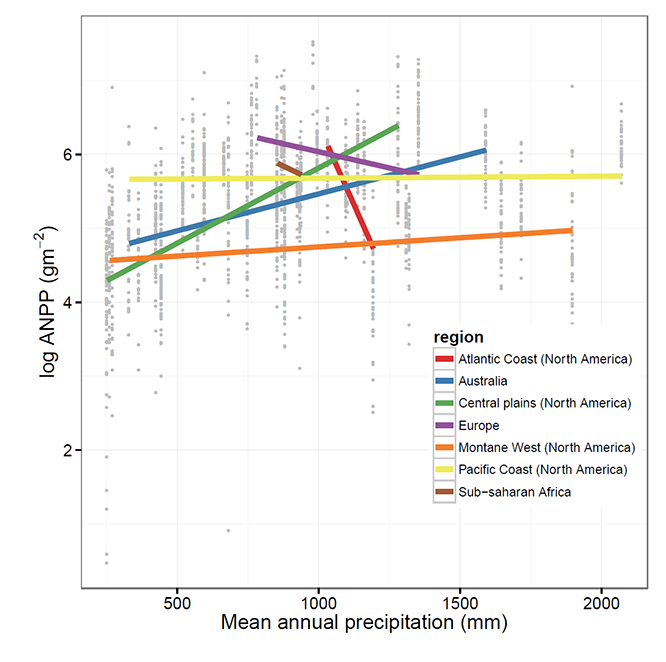
Figure B5: Relationship of ANPP to MAP by region
Figure B6: Relationship of ANPP to N deposition by region.
Table B1. Site location, climate, and production data.
site_code |
latitude |
longitude |
elevation (m) |
MAT (C) |
MAP (mm) |
PET (mm) |
Atmospheric N (kg/ha/y) |
mean soil pH |
mean soil C (%) |
mean soil N (%) |
mean soil P (ppm) |
mean production (g/m²) |
amcamp.us |
48.465 |
-123.014 |
41 |
9.8 |
557 |
740 |
3.68 |
5.56 |
7.31 |
0.48 |
64.80 |
441.01 |
azi.cn |
33.670 |
101.870 |
3500 |
2 |
667 |
852 |
9.58 |
5.85 |
6.19 |
0.54 |
68.97 |
369.18 |
barta.us |
42.245 |
-99.652 |
767 |
8.7 |
597 |
1086 |
6.99 |
5.99 |
0.64 |
0.06 |
17.37 |
205.79 |
bldr.us |
39.972 |
-105.234 |
1633 |
9.7 |
425 |
1151 |
1.94 |
6.82 |
1.37 |
0.10 |
16.50 |
167.00 |
bnch.us |
44.277 |
-121.968 |
1318 |
5.5 |
1647 |
860 |
2.84 |
5.55 |
8.87 |
0.61 |
13.83 |
141.99 |
bogong.au |
-36.874 |
147.254 |
1760 |
5.7 |
1592 |
833 |
5.15 |
4.47 |
8.78 |
0.58 |
44.37 |
416.19 |
bttr.us |
44.280 |
-121.957 |
1500 |
5 |
1718 |
852 |
2.84 |
5.58 |
11.98 |
0.96 |
22.47 |
231.33 |
burrawan.au |
-27.735 |
151.140 |
425 |
18.4 |
683 |
1573 |
2.25 |
5.61 |
1.30 |
0.08 |
17.07 |
272.37 |
cbgb.us |
41.785 |
-93.385 |
275 |
9 |
855 |
1007 |
18.00 |
6.09 |
0.63 |
0.06 |
62.89 |
243.25 |
cdcr.us |
45.401 |
-93.201 |
270 |
6.3 |
750 |
898 |
6.98 |
5.67 |
0.80 |
0.06 |
59.22 |
196.92 |
cdpt.us |
41.200 |
-101.630 |
965 |
9.5 |
445 |
1127 |
3.12 |
6.61 |
1.40 |
0.12 |
32.67 |
120.39 |
cowi.ca |
48.460 |
-123.380 |
50 |
9.8 |
764 |
713 |
3.68 |
5.62 |
5.17 |
0.39 |
40.57 |
469.45 |
derr.au |
-37.807 |
144.791 |
38 |
14.5 |
574 |
1100 |
2.15 |
5.92 |
2.36 |
0.17 |
8.08 |
123.17 |
fnly.us |
44.410 |
-123.280 |
68 |
11.3 |
1104 |
1015 |
2.84 |
5.23 |
3.53 |
0.23 |
13.68 |
257.51 |
frue.ch |
47.113 |
8.542 |
995 |
6.5 |
1355 |
650 |
18.63 |
5.49 |
3.76 |
0.37 |
71.10 |
616.86 |
gilb.za |
-29.284 |
30.292 |
1748 |
13.1 |
926 |
1194 |
5.03 |
5.14 |
20.57 |
1.16 |
17.70 |
280.53 |
glac.us |
46.869 |
-123.034 |
33 |
10.5 |
1311 |
945 |
3.68 |
5.11 |
15.67 |
1.15 |
23.77 |
164.67 |
hall.us |
36.872 |
-86.702 |
194 |
13.6 |
1282 |
1218 |
14.29 |
5.16 |
1.45 |
0.13 |
33.17 |
441.10 |
hart.us |
42.724 |
-119.498 |
1508 |
7.4 |
272 |
1087 |
2.02 |
7.22 |
1.21 |
0.10 |
66.63 |
175.71 |
hnvr.us |
43.419 |
-72.138 |
271 |
6.4 |
1033 |
912 |
19.35 |
5.05 |
4.43 |
0.38 |
63.93 |
442.25 |
kiny.au |
-36.200 |
143.750 |
90 |
15.5 |
426 |
1321 |
2.15 |
6.05 |
1.24 |
0.11 |
10.13 |
151.50 |
lancaster.uk |
53.986 |
-2.628 |
180 |
8 |
1322 |
599 |
12.96 |
4.77 |
20.13 |
1.07 |
32.69 |
156.48 |
lead.us |
46.615 |
-124.048 |
2 |
9.9 |
2072 |
766 |
3.68 |
5.10 |
12.39 |
0.83 |
145.20 |
467.39 |
look.us |
44.205 |
-122.128 |
1500 |
4.8 |
1898 |
820 |
2.84 |
5.07 |
16.66 |
1.20 |
51.73 |
98.13 |
mtca.au |
-31.782 |
117.611 |
285 |
17.3 |
330 |
1505 |
1.07 |
5.26 |
1.38 |
0.09 |
9.13 |
104.15 |
pape.de |
53.086 |
7.473 |
1 |
8.9 |
783 |
666 |
35.32 |
4.02 |
16.50 |
0.66 |
62.30 |
917.76 |
sage.us |
39.430 |
-120.240 |
1920 |
5.7 |
882 |
1028 |
3.36 |
6.06 |
8.91 |
0.68 |
35.83 |
121.12 |
sava.us |
33.344 |
-81.651 |
71 |
17.3 |
1194 |
1432 |
10.32 |
5.00 |
0.78 |
0.03 |
47.60 |
58.14 |
sedg.us |
34.700 |
-120.017 |
550 |
14.9 |
521 |
1278 |
1.14 |
6.83 |
2.27 |
0.19 |
66.13 |
197.35 |
sereng.tz |
-2.255 |
34.513 |
1536 |
22.1 |
854 |
1662 |
7.37 |
6.76 |
1.64 |
0.13 |
67.00 |
308.05 |
sevi.us |
34.359 |
-106.691 |
1600 |
12.6 |
252 |
1473 |
1.96 |
8.34 |
0.32 |
0.03 |
33.53 |
95.38 |
sgs.us |
40.817 |
-104.767 |
1650 |
8.4 |
365 |
1122 |
3.12 |
6.12 |
0.84 |
0.09 |
64.87 |
129.56 |
shps.us |
44.243 |
-112.198 |
910 |
5.5 |
262 |
978 |
1.85 |
7.88 |
2.40 |
0.21 |
37.55 |
99.37 |
sier.us |
39.236 |
-121.284 |
197 |
15.6 |
935 |
1340 |
3.36 |
5.97 |
2.27 |
0.18 |
17.30 |
180.86 |
smith.us |
48.207 |
-122.625 |
62 |
9.8 |
597 |
767 |
3.68 |
6.06 |
7.23 |
0.54 |
74.43 |
392.68 |
spin.us |
38.136 |
-84.501 |
271 |
12.5 |
1140 |
1139 |
13.88 |
6.39 |
2.64 |
0.26 |
229.17 |
468.42 |
summ.za |
-29.812 |
30.716 |
679 |
18.2 |
939 |
1282 |
5.03 |
5.14 |
6.50 |
0.33 |
12.13 |
313.08 |
temple.us |
31.044 |
-97.349 |
184 |
19.1 |
871 |
1463 |
7.25 |
7.68 |
9.82 |
0.37 |
19.85 |
317.32 |
tyso.us |
38.519 |
-90.565 |
169 |
12.5 |
997 |
1178 |
11.13 |
5.88 |
3.05 |
0.27 |
23.88 |
440.66 |
ukul.za |
-29.670 |
30.400 |
843 |
18.1 |
880 |
1393 |
5.03 |
5.70 |
5.13 |
0.32 |
9.27 |
468.98 |
unc.us |
36.008 |
-79.020 |
141 |
14.6 |
1163 |
1275 |
13.12 |
5.28 |
2.17 |
0.16 |
21.57 |
304.18 |
valm.ch |
46.631 |
10.372 |
2320 |
0.3 |
1098 |
442 |
18.91 |
5.64 |
7.86 |
0.61 |
45.83 |
321.98 |
Table B2. Coefficient of variation of variables used to predict ANPP (variables were standardized in analysis). CV is defied as 100*SD/Mean where SD is the standard deviation.
Predictor |
N |
Coefficient of Variation |
MAP |
42 |
49.46 |
PET |
42 |
25.27 |
MAT |
42 |
45.30 |
MAP_VAR |
42 |
48.02 |
TEMP_VAR |
42 |
39.87 |
N_deposition |
42 |
83.59 |
pH |
1310 |
15.08 |
SoilN |
1310 |
93.92 |
SoilP |
1310 |
87.88 |
 b)
b)
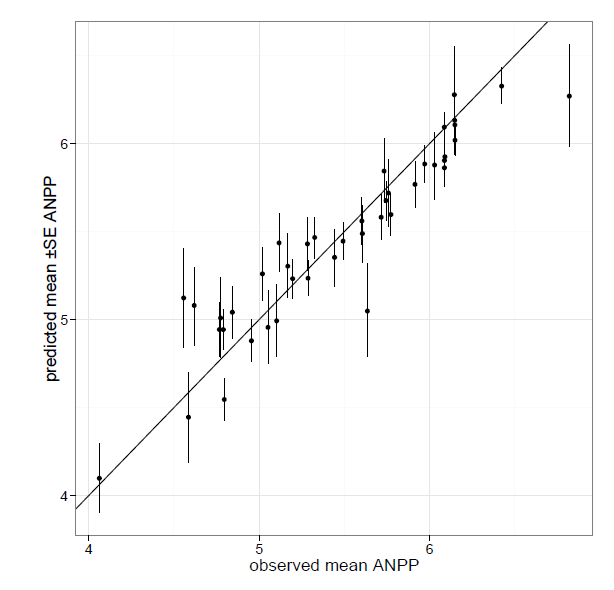
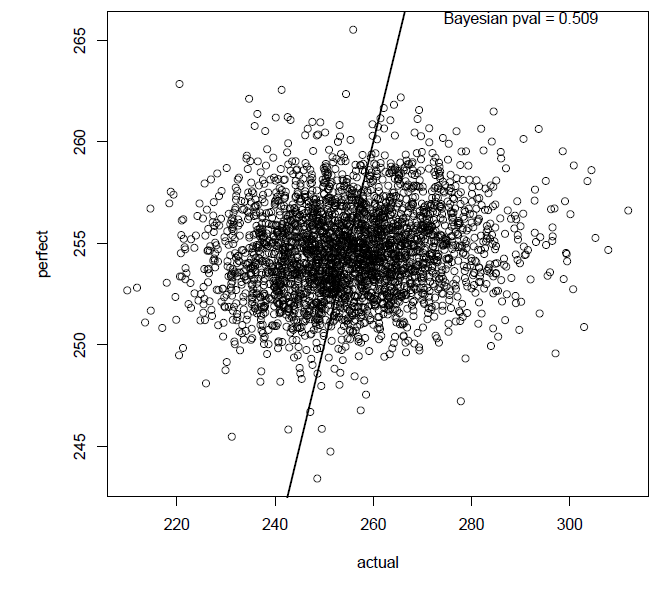
Fig. B1. Posterior model preictions and model checking.
(a) Observed (x-axis) vs. predicted mean ANPP by site. Error bars are 95% Credible intervals on predictions.
(b) Posterior-predictive check, performed by drawing one random observation from the model for each observed data point, creating “perfect” residuals. These are plotted against actual residuals from the model. A Bayesian pvalue (the mean fraction of perfect residuals greater than the actual residuals) is extremely close to 0.5, indicating appropriate model construction.
Fig. B2. Results of multi-level model excluding N deposition. The multi-level model was run as described in the main text but without N deposition included as a site-level predictor. Despite mild correlation between PET and N deposition values across sites, PET is not a good predictor of ANPP either with or without N deposition in the model. The model without N deposition (below) had a Deviance Information Criterion (DIC, a Bayesian generalization of Akaike’s Information Criterion) of 1689.3, whereas the model including N deposition (main text) had a much lower DIC of 1626.2.
Fig. B3. Results of model using dataset excluding highest N deposition site. The multi-level model was run exactly as in the main text but with the omission of the Papenburg, Germany (pape.de) site, which had extraordinarily high N deposition values. N deposition remained a strong and significant predictor of site production. Solid line and dark shading: full model from main text; dashed line and light shading: N deposition influence on site intercept excluding the highest N deposition site.
Fig. B4. Interactions between site- and plot-level predictors in the multi-level model. Here the slope estimate of primary production (ANPP) to edaphic conditions (soil pH, N, C, and P) within each site is related to the site-level N deposition. A significant ‘interaction’ would be revealed by predictability of within-site slopes by across-site variance in N deposition. No such interactions appeared in the model.
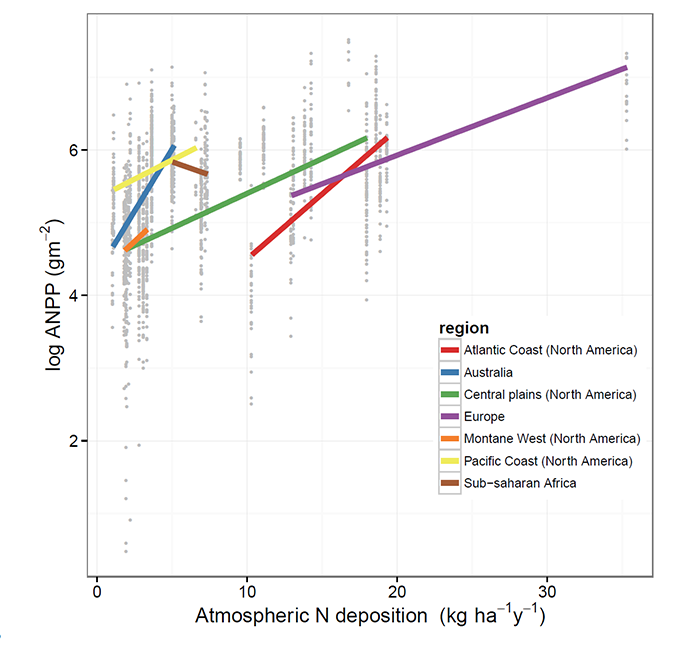
Fig. B5. Relationship of ANPP to MAP by region. Shown are raw data points (plot-level ANPP measurements) vs. site-level MAP. Lines are best fit linear slopes by region. Regions represent coherent geographic land masses, although sites are not equally replicated within regions.
Fig. B6. Relationship of ANNP to N deposition by region. Shown are raw data points (plot-level ANPP measurements) vs. site-level N deposition. Lines are best fit linear slopes by region. Regions represent coherent geographic land masses, although sites are not equally replicated within regions.