Ecological Archives E096-124-A2
Maya C. Pfaff, George M. Branch, Jennifer L. Fisher, Vera Hoffmann, Allan G. Ellis, and John L. Largier . 2015. Delivery of marine larvae to shore requires multiple sequential transport mechanisms. Ecology 96:13991410. http://dx.doi.org/10.1890/14-0229.1
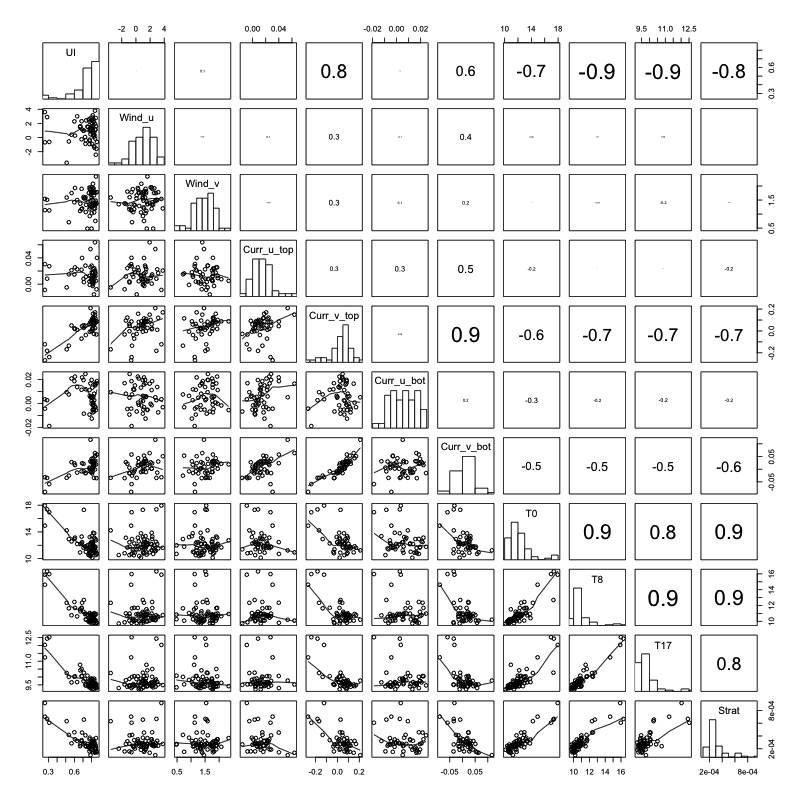
Appendix B. A correlations matrix showing the relationship between the upwelling index (UI) with other physical variables at Elands Bay (Fig. B1) and Cape Columbine (Fig. B2).
At both sites, UI showed positive relationships with equatorward surface currents, and – as expected for a temperature-derived index - strong negative relationships with near-intertidal and offshore temperatures, and with stratification, indicating that it adequately captured the advection of cold water during upwelling and the water-column stratification and warming during relaxation/downwelling (Figs. B1 and B2).
Fig. B1. Elands Bay: correlation matrix of daily-averaged physical variables of the study period showing coefficients (r, rounded and font size scaled according to p value), frequency distributions and scatterplots used to evaluate the coastal upwelling index (UI). Abbreviated names of variables are indicated in diagonal histograms: Wind_u = onshore wind, Wind_v = equatorward wind, Curr_u_top = onshore current in top layer, Curr_v_top = equatorward current in top layer, Curr_u_bot = onshore current in bottom layer, Curr_v_bot = equatorward current in bottom layer, T0–T17 = temperatures at 0–17 m depth, Strat = stratification index (Brunt-Väisälä frequency).
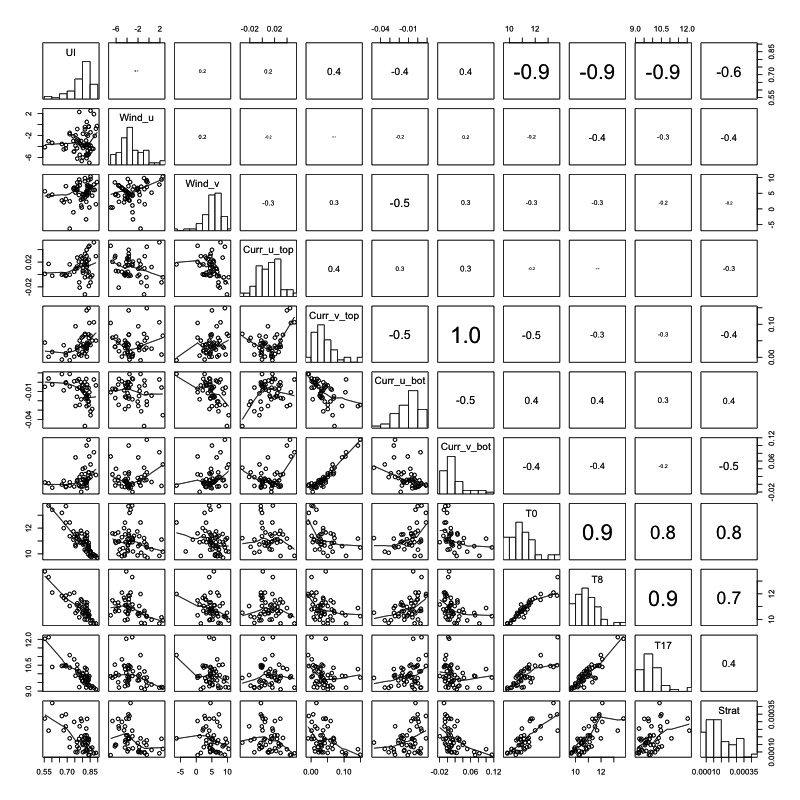
Fig. B2. Cape Columbine: correlation matrix of daily-averaged physical variables of the study period showing coefficients (r, rounded and scaled), frequency distributions and scatterplots used to evaluate the coastal upwelling index (UI). Abbreviated names of variables are indicated in diagonal histograms (for details see caption of Fig. B1).