Ecological Archives E096-120-A3
Verena Riedinger, Oliver Mitesser, Thomas Hovestadt, Ingolf Steffan-Dewenter, and Andrea Holzschuh. 2015. Annual dynamics of wild bee densities: attractiveness and productivity effects of oilseed rape. Ecology 96:13511360. http://dx.doi.org/10.1890/14-1124.1
Appendix C. Second best models for the influence of the cover of oilseed rape in the previous year (p0) and in the year of pollinator sampling (p1) for wild bees (excl. Bombus) and bumble bees.
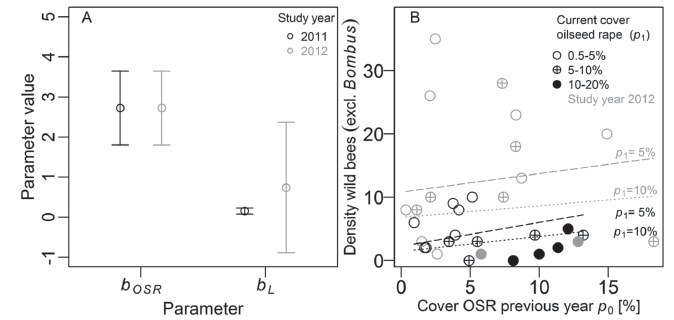
Fig C1. (A) Comparison of the estimated model parameters bOSR (per-area bee productivity OSR) and bL (per-area bee productivity rest of the landscape) for the second best model (Table 1) for densities of wild bees other than Bombus with confidence intervals for study year 2011 (black) and study year 2012 (gray); (B) Relationship between the cover of oilseed rape (OSR) in the previous year and the densities of wild bees (excl. Bombus) on 32 OSR fields in two years. Fitted lines are calculated by the second best model (Table 1) and the corresponding model equation (Appendix A, Table A1) for specific values of cover of OSR in the year of pollinator sampling (p1: 5%, 10% respectively). Black symbols show densities in study year 2011, gray symbols show densities in study year 2012. Different symbols represent different values of the cover of current OSR in the year of pollinator sampling (p1).
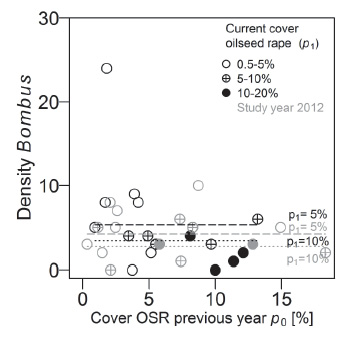
Fig. C2. Relationship between the cover of oilseed rape (OSR) in the previous year and the densities of bumble bees on 32 OSR fields in two years. Fitted lines are calculated by the second best model (Table 2) and the corresponding model equation (Appendix A, Table A1) for specific values of the cover of OSR in the year of pollinator sampling (pa: 5%, 10% respectively). Black symbols show densities in study year 2011, gray symbols show densities in study year 2012. Different symbols represent different values of cover of OSR in the year of pollinator sampling (pa).
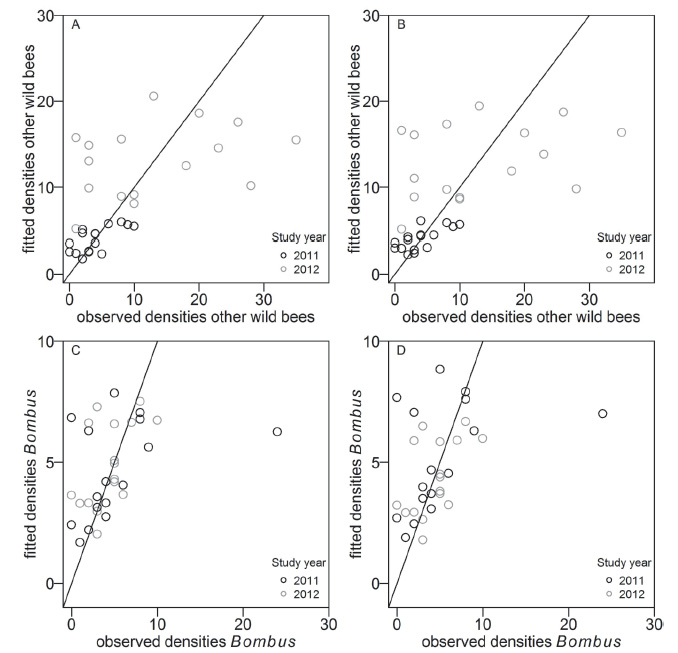
Fig. C3. Relationship between fitted and observed values for (A) the best model for other wild bees (Table 1, figure 3A) (B) the second best model for other wild bees (Table 1, Fig. C1B) (C) the best model for bumble bees (Table 2, Fig. 3C) (D) the second best model for bumble bees (Table 2, Fig. C2). As expected with Poisson distributed data the variance is directly coupled to the mean value. This results in a funnel shaped pattern of observed bee densities.