Ecological Archives E096-119-A3
Francesco Carrara, Andrea Giometto, Mathew Seymour, Andrea Rinaldo, and Florian Altermatt. 2015. Experimental evidence for strong stabilizing forces at high functional diversity of aquatic microbial communities. Ecology 96:13401350. http://dx.doi.org/10.1890/14-1324.1
Appendix C. Interactions resulting in competitive/mutualistic loops between the 11 protist species adopted in the interaction experiments.
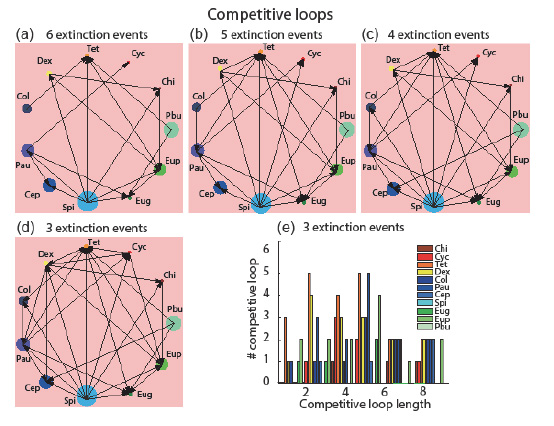
Fig. C1. Interactions resulting in competitive loops between the 11 protist species adopted in the interaction experiments. (a–d) Adjacency graphs show competitive exclusion dynamics between 11 protist species: arrows point from the excluded species to the superior competitor, for decreasing extinction events over the six replicates ( (a) deterministic extinction, i.e., six extinction events over six rounds, (d) three extinction over six rounds). Interestingly, no loops due to intransitivity in competitive interactions (e.g., rock, paper, scissors) were detected, reflecting a high transitivity of the interaction matrix. Competitive loops were detected only for adjacency matrices that were connecting species with three or less extinctions over six experimental rounds (Nloops![]() , Nloops
, Nloops![]() N, Nloops
N, Nloops![]() ), where ex is the number of extinctions over the six experimental replicates. Panel (e) show the distribution of loop lengths for each species considering three extinction events. Circle size reflects the species' body size, and different colors are associated to different functional groups (red to yellow, small bacterivorous protists, Chilomonas sp., Cyclidium sp., Tetrahymena sp., Dexiostoma sp.; dark blue to cyan, large bacterivorous protists, Colpidium sp., Paramecium aurelia, Cephalodella sp., Spirostomum sp.; dark to light green, mixotrophic protists, Euglena gracilis, Euplotes aediculatus, Paramecium bursaria). Small protists (Cyc, red, Tet, orange, Dex, yellow) and Pau (dark blue) took part in more numerous and shorter competitive loops (also had the highest connectivity degree, see upper panels) compared to mixotrophs (green species).
), where ex is the number of extinctions over the six experimental replicates. Panel (e) show the distribution of loop lengths for each species considering three extinction events. Circle size reflects the species' body size, and different colors are associated to different functional groups (red to yellow, small bacterivorous protists, Chilomonas sp., Cyclidium sp., Tetrahymena sp., Dexiostoma sp.; dark blue to cyan, large bacterivorous protists, Colpidium sp., Paramecium aurelia, Cephalodella sp., Spirostomum sp.; dark to light green, mixotrophic protists, Euglena gracilis, Euplotes aediculatus, Paramecium bursaria). Small protists (Cyc, red, Tet, orange, Dex, yellow) and Pau (dark blue) took part in more numerous and shorter competitive loops (also had the highest connectivity degree, see upper panels) compared to mixotrophs (green species).
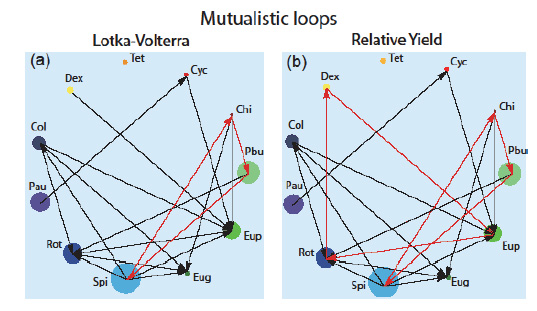
Fig. C2. Interactions resulting in mutualistic loops between the 11 protist species. The Lotka-Volterra (LV) interaction matrix (Fig. 2A in the main text) is used in (a), and the Relative-Yield (RY) interaction matrix in (b). The RY method considers the interaction term ![]() . Arrows in the adjacency graphs point from the prey (cooperator) to the predator (defector). Circle size reflects the species' body size, and different colors are associated with different functional groups (same color code as in Fig. C1). A mutualistic loop (red arrows) between Chi-Pbu-Spi was detected for the LV-adjacency matrix. The RY method detected the same links, but showed also a mutualistic loop between Dex-Eup-Cep. Each species in mutualistic loops belong to a different functional group.
. Arrows in the adjacency graphs point from the prey (cooperator) to the predator (defector). Circle size reflects the species' body size, and different colors are associated with different functional groups (same color code as in Fig. C1). A mutualistic loop (red arrows) between Chi-Pbu-Spi was detected for the LV-adjacency matrix. The RY method detected the same links, but showed also a mutualistic loop between Dex-Eup-Cep. Each species in mutualistic loops belong to a different functional group.