Ecological Archives E096-115-A2
Steve J. Kroiss and Janneke HilleRisLambers. 2015. Recruitment limitation of long-lived conifers: implications for climate change responses. Ecology 96:12861297. http://dx.doi.org/10.1890/14-0595.1
Appendix B. Detailed description of methods for collecting microclimate data and estimating missing data.
To measure soil moisture, we used a Decagon Devices ECH2O Check soil moisture probe (5 cm in length) to quantify soil moisture four times within each plot during each annual germinant census. To quantify snow duration, we used HOBO temperature loggers placed on the soil surface in the center of each seedling plot to record temperature every three hours during months with potential snowpack (September–July). Because snow acts as an insulator, temperature readings could be used to calculate snowpack duration in each plot following methods from Raleigh et al. (2013) and Ford et al. (2013). Data for snowpack duration and soil moisture was occasionally missing in some plots due to sensor failure. We replaced these missing values with estimates from models fit to all relevant microclimate data (only 12% of our dataset was missing one or both values). Results were qualitatively similar when we repeated analyses excluding observations with missing microclimatic variables.
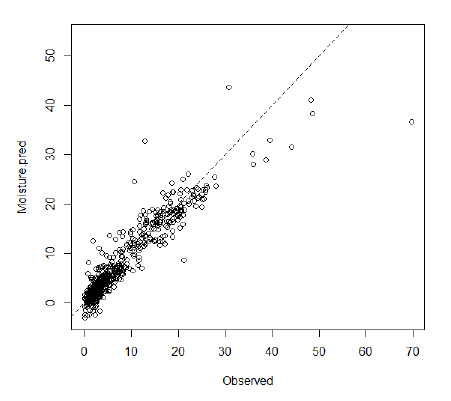
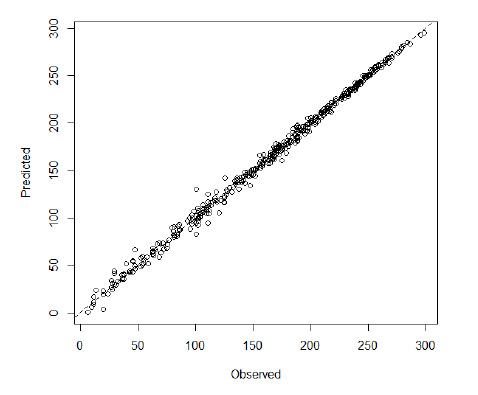
Sensor failures or errors represented instances in which a temperature data logger failed mid-winter within one of the plots within a stand, thus preventing us from measuring snowpack duration for the year in that plot. We replaced missing microclimatic values of snowpack duration and soil moisture with model estimations. This was possible because spatial and annual differences in snow duration and soil moisture were highly consistent between plots and stands. Thus, to estimate missing microclimatic variables, we employed linear models and AIC model selection to select the best predictive model that included an interaction between stand and year and an interaction between stand and plot. These model estimates accounted for 12% of the total snowpack duration data set (155 out of 1299 data points) and 0.5% of the soil moisture data set (7 out of 1299 data points). Model predictions vs. observed values were high, R² = 0.99 for snowpack duration and 0.81 for soil moisture (Fig. S2). We also checked that results were qualitatively similar when we ran models on a reduced data set excluding all observations where microclimatic variables are missing.
Fig. B1. Predicted vs. observed snowpack duration (in days). Dashed line indicates 1 to 1 line. R² = 0.99.
Fig. B2. Predicted vs. observed soil moisture (in percent saturation). Dashed line indicates 1 to 1 line. R² = 0.81.
Literature cited
Ford, K. R., A. K. Ettinger, J. D. Lundquist, M. S. Raleigh, and J. Hille Ris Lambers. 2013. Spatial heterogeneity in ecologically important climate variables at coarse and fine scales in a high-snow mountain landscape. PloS One, 8(6), e65008. doi:10.1371/journal.pone.0065008
Raleigh, M. S., K. Rittger, C. E. Moore, B. Henn, J. a. Lutz, and J. D. Lundquist. 2013. Ground-based testing of MODIS fractional snow cover in subalpine meadows and forests of the Sierra Nevada. Remote Sensing of Environment 128:44–57. doi:10.1016/j.rse.2012.09.016