Ecological Archives E096-115-A1
Steve J. Kroiss and Janneke HilleRisLambers. 2015. Recruitment limitation of long-lived conifers: implications for climate change responses. Ecology 96:12861297. http://dx.doi.org/10.1890/14-0595.1
Appendix A. Supplementary study site information.
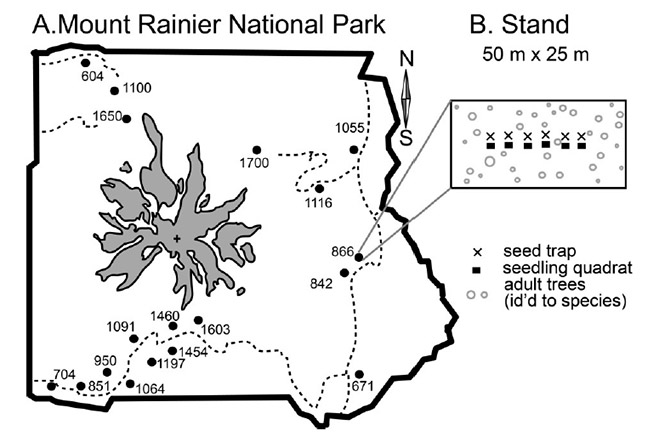
Fig. A1. Panel A displays a map of the 18 forest stands in which we studied recruitment limitation in Mount Rainier National Park, USA. Numbers in this plot represent the elevation of each stand in meters. The shaded area indicates areas with glaciers and the dashed line indicates roads within the park. Panel B illustrates the layout within stands. Seed production was censused using six seed traps (0.176 m² laundry baskets) spaced 5 m apart. Seedlings were censused in 1 m² plots adjacent to each seed trap. All trees above 15 cm DBH within the stand were measured for DBH.
Table A1. Environmental characteristics for each of the 18 forest stands. Climatic data were obtained from the PRISM (Parameter-elevation Regressions on Independent Slopes Model) climate-mapping model (Daly et al. 2008).
Stand |
Elevation (m) |
Latitude |
Longitude |
Side |
Mean annual temperature (°C) |
Cumulative precipitation (cm) |
TO11 |
564 |
46.9945 |
-121.8870 |
NW |
7.59 |
149.77 |
TA01 |
630 |
46.7413 |
-121.5581 |
E |
7.98 |
153.67 |
TO04 |
643 |
46.7404 |
-121.8884 |
SW |
7.56 |
152.32 |
TB13 |
792 |
46.7404 |
-121.8480 |
SW |
7.38 |
156.58 |
AV02 |
835 |
46.8238 |
-121.5505 |
E |
6.61 |
136.86 |
AO03 |
855 |
46.8268 |
-121.5482 |
E |
6.46 |
136.27 |
AG05 |
913 |
46.7474 |
-121.8044 |
SW |
6.8 |
174.4 |
AV06 |
1035 |
46.7763 |
-121.7842 |
SW |
5.96 |
201.42 |
AB08 |
1042 |
46.9201 |
-121.5372 |
E |
5.85 |
124.87 |
AX15 |
1062 |
46.7503 |
-121.8246 |
SW |
6.28 |
160.45 |
AV14 |
1081 |
46.9599 |
-121.8476 |
NW |
5.64 |
205.38 |
PP17 |
1128 |
46.8949 |
-121.6033 |
E |
5.11 |
156.87 |
AM16 |
1170 |
46.7686 |
-121.7575 |
SW |
5.19 |
223.67 |
AE10 |
1431 |
46.7682 |
-121.7433 |
SW |
4.77 |
235.44 |
AR07 |
1435 |
46.7763 |
-121.7479 |
SW |
4.63 |
235.66 |
PARA |
1608 |
46.7765 |
-121.7323 |
SW |
3.98 |
240.22 |
SPRY |
1700 |
46.9191 |
-121.8360 |
NW |
3.1 |
276.62 |
SUNR |
1800 |
46.9286 |
-121.6551 |
E |
2.27 |
170.49 |
Table A2. Basal area measurements (m²/hectare) for each of the study species in the 18 stands.
Stand |
Abies amabilis |
Callitropsis |
Pseudotsuga |
Thuja plicata |
Tsuga heterophylla |
Tsuga mertensiana |
TO11 |
0 |
0 |
79.84 |
0 |
41.34 |
0 |
TA01 |
0.5 |
0 |
93.45 |
0 |
11.57 |
0 |
TO04 |
2.63 |
0 |
0 |
29.06 |
26.33 |
0 |
TB13 |
0 |
0 |
63.02 |
18.62 |
29.44 |
0 |
AV02 |
21.93 |
0 |
0 |
2.01 |
38.54 |
0 |
AO03 |
29.69 |
0 |
59.07 |
73.91 |
34.01 |
0 |
AG05 |
29.37 |
0 |
11.74 |
27.76 |
8.3 |
0 |
AV06 |
27.01 |
0 |
0 |
0 |
11.63 |
0 |
AB08 |
0 |
0 |
0 |
8.04 |
50.8 |
0 |
AX15 |
0 |
0 |
30.29 |
6.73 |
33.84 |
0 |
AV14 |
41.5 |
0 |
0 |
0 |
50.01 |
0 |
PP17 |
0 |
0 |
15.72 |
0 |
1.03 |
0 |
AM16 |
9.79 |
22.55 |
0 |
0 |
9.47 |
21.53 |
AE10 |
42.93 |
46.11 |
0 |
0 |
0 |
0 |
AR07 |
18.2 |
15.34 |
0 |
0 |
0 |
51.34 |
PARA |
21.46 |
2.82 |
0 |
0 |
0 |
39.87 |
SPRY |
34.9 |
5.52 |
0 |
0 |
0 |
25.56 |
SUNR |
33.37 |
26.35 |
0.15 |
0 |
0 |
16.18 |
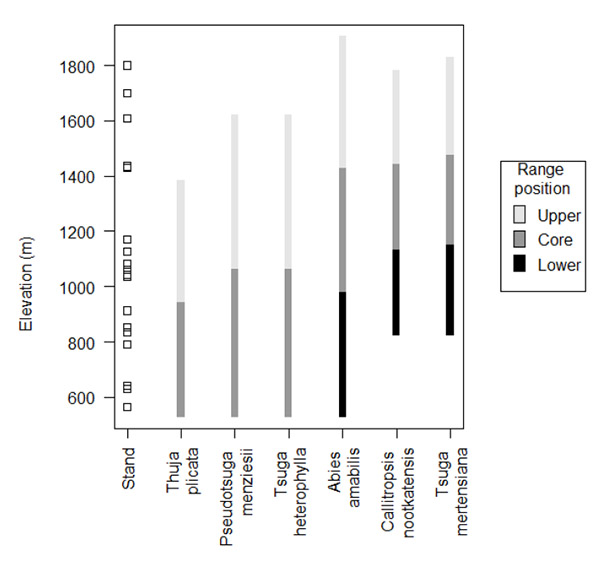
Fig. A2. The elevational position of each of the 18 forest stands along with range classifications for each species. Species' ranges were divided into thirds (lower, core, or upper) based on the recorded minimum and maximum elevational position for each species based on previous forest surveys on Mount Rainier (Franklin et al. 1988). The ranges for three of the species (Thuja plicata, Pseudotsuga menziesii, and Tsuga heterophylla), extend below the lowest elevations in the park and their ranges were thus divided in half: core and upper.
Literature cited
Daly, C., M. Halbleib, J. Smith, W. Gibson, M. Doggett, G. Taylor, J. Curtis, and P. Pasteris. 2008. Physiographically sensitive mapping of climatological temperature and precipitation across the conterminous United States. International Journal of Climatology 28:2031–2064.