Ecological Archives E096-112-A6
Rafael X. De Camargo and David J. Currie. 2015. An empirical investigation of why speciesarea relationships overestimate species losses. Ecology 96:12531263. http://dx.doi.org/10.1890/13-2362.1
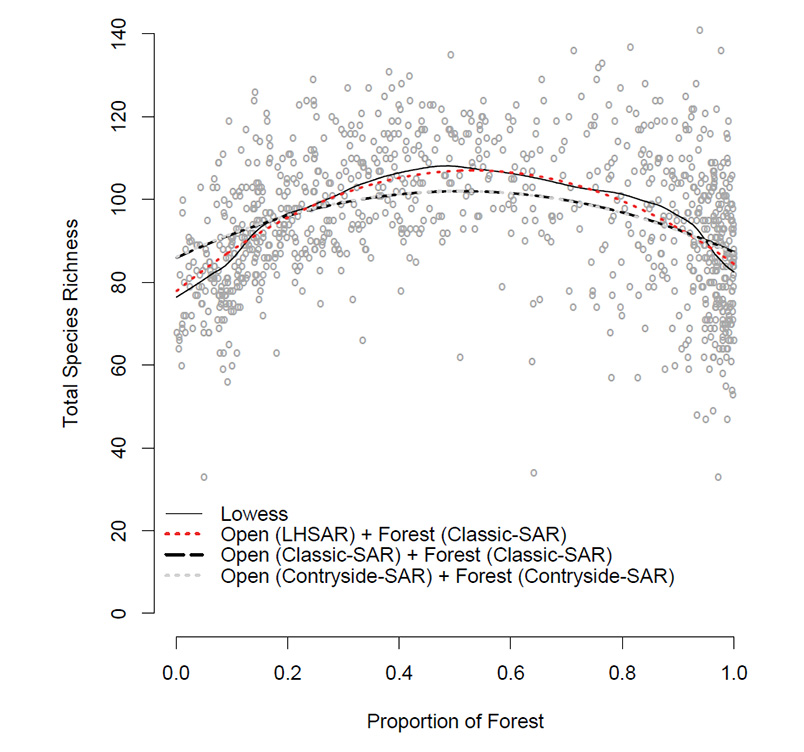
Appendix F. The peaked relationship between total avian species richness and the proportion of natural land cover reconstructed by the sum of two derived species-area models.
Fig. F1. The pattern of total avian richness as function of forest cover reconstructed with different multi-habitat models approaches. Open circles represent observed total richness in 991 quadrats in southern Ontario (solid line, LOWESS curve). Open models represent open-habitat richness modeled as a function of human-dominated landscapes, and forest models fit forest richness as function of forest cover. Dotted-line: the sum of the best-fitting species-area relationships for open-habitat species richness (LH-SAR) and forest species richness (Classic-SAR). Long-dashed line represent the sum of two Classic-SAR models (Desrochers et al. 2011) fitted for open-habitat and forest richness. The sum of the two Countryside-SARs also predicts total richness as the sum of two Classic-SARs (dotted gray line over the long-dashed line). Model parameters and statistics are presented in the main text (Table 1).
Literature Cited
Desrochers, R. E., J. T. Kerr, and D. J. Currie. 2011. How, and how much, natural cover loss increases species richness. Global Ecology and Biogeography:1–11.