Ecological Archives E096-112-A5
Rafael X. De Camargo and David J. Currie. 2015. An empirical investigation of why speciesarea relationships overestimate species losses. Ecology 96:12531263. http://dx.doi.org/10.1890/13-2362.1
Appendix E. The effects of the two biomes (Laurentian Shield and Mixed-wood plains) on patterns of species richness.
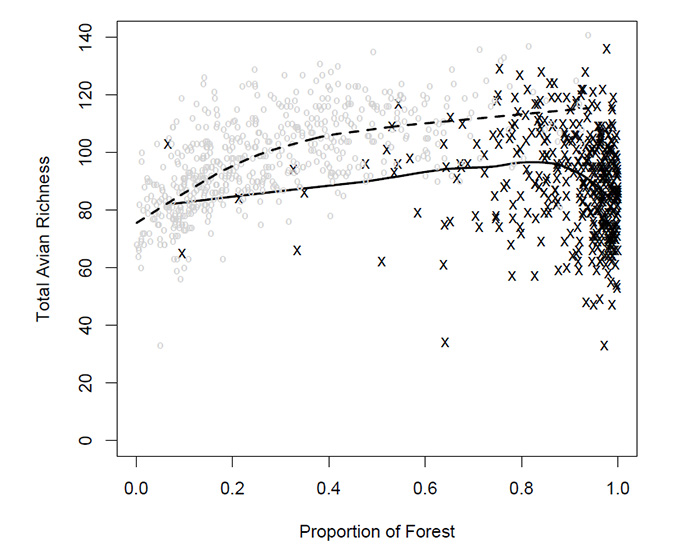
In the main text, we hypothesized that the peaked relationship between total richness and forest cover is due the amount of habitat that is available for bird species in human-dominated areas. In this supplementary material we ask: might the peaked shape of the richness-forest-cover relationship be the result of combining data from two biomes? To answer this question, we present the relationships between total avian species richness and the proportion of natural land cover (forest) in the Mixed-wood Plains and the Laurentian (boreal) Shield biomes separately (Fig. E1). The classification of the biomes follows the map distribution of the cited biomes in Cadman et al., 2007 (Fig. E2).
Total species richness has a peaked relationship with natural land cover in quadrats located on the Laurentian Shield (open circles, Fig. E1). However, richness increases monotonically with forest cover in the (mixed-wood) quadrats off the Shield. The monotonic positive relationship between total avian richness and natural forest cover in the Mixed-wood Plains biome may simply be a sampling artifact. There are very few quadrats in the Mixed-wood Plains covered by a high proportion of forest. Those quadrats are often surrounded by agriculture. The forest in those quadrats is almost certainly fragmented by roads, houses, etc, at a scale too small to be detected in remote sensing. Consequently, a fully-forested quadrat in the south is likely to contain small patches of habitat for open-habitat species (and therefore to have higher than usual species richness). In contrast, forested quadrats on the Laurentian Shield are typically within large tracts of continuous forest, with much less fine-scale human intrusion, and less fine-grained habitat for open-habitat species.
We cannot totally exclude the possibility that combining richness-area relationships in two biomes may have affected the peaked pattern observed between richness and forest cover in southern Ontario. The poor representation of quadrats with high forest cover in the Mixed-wood Plains data may bias the shape of the relationship at low percentages of forest cover. In contrast, fully forested quadrats are abundant on the Laurentian Shield. There, the peaked pattern of richness-area relationship emerges, as in the total data set.
Fig. E1. The relationships between total avian species richness and the proportion of forested land cover in both Mixed-wood plains and Laurentian Shield biomes. Empty circles represent the BBA squares located on Mixed-wood plains. The "x" dots represent the squares on Laurentian Shield biome. The black lines are the LOESS curve for both relationships.
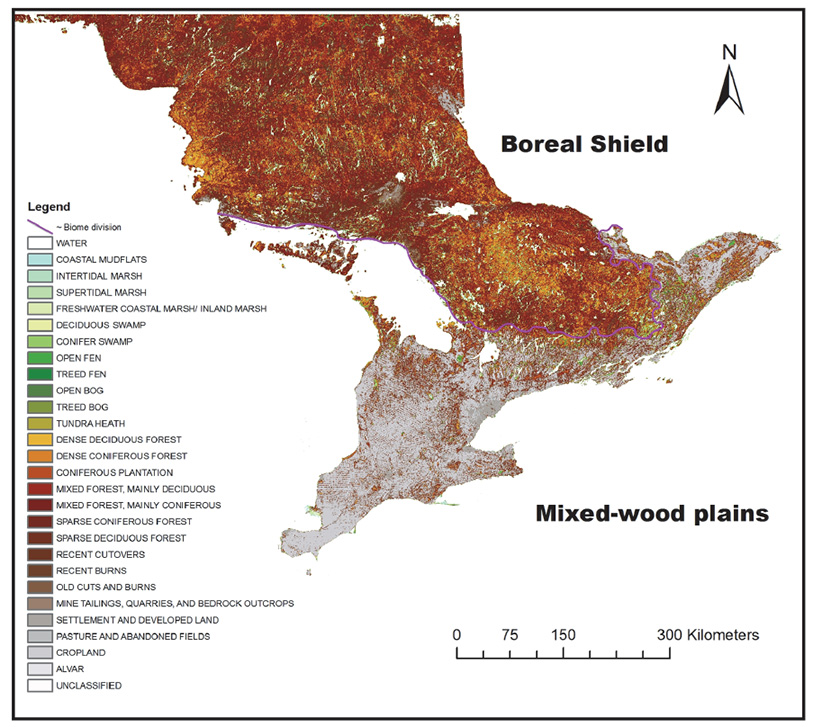
Fig. E2. Laurentian Boreal Shield and Mixed-wood plains biomes represented in southern Ontario, Canada. Map source: Ontario Provincial-Scale Land Cover data set produced by the Ontario Ministry of Natural Resources (2002) from Landsat ThematicMapper (TM) scenes captured primarily in the 1990s (resampled to a 25-m resolution).
Literature Cited
Cadman, M. D., D. A. Sutherland, G. G. Beck, D. Lepage, and A. R. Couturier. 2007. Atlas of the breeding birds of Ontario, 2001–2005. Bird Studies Canada, Environment Canada, Ontario Field Ornithologists, Ontario Ministry of Natural Resources, and Ontario Nature, Toronto, ON.