Ecological Archives E096-095-A1
Brandon S. Schamp, Shelley E. Arnott, and Katelyn L. Joslin. 2015. Dispersal strength influences zooplankton co-occurrence patterns in experimental mesocosms. Ecology 96:10741083. http://dx.doi.org/10.1890/14-1128.1
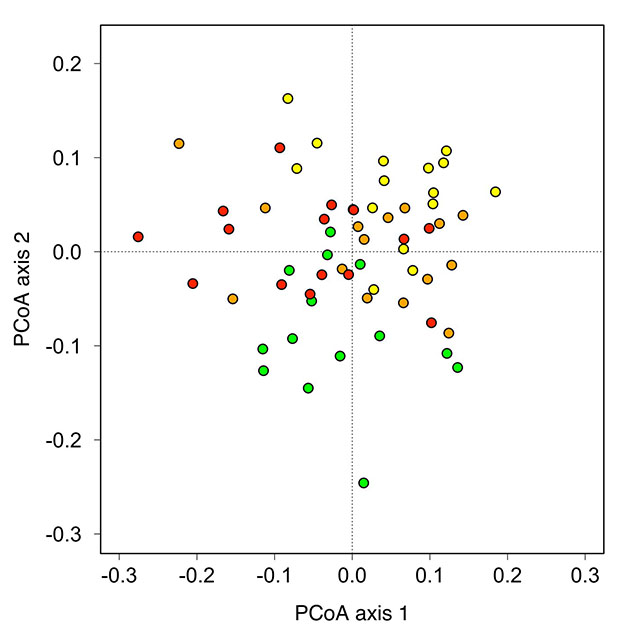
Appendix A. A summary of chemical and physical data for the five source lakes that contributed dispersers for this study and for mesocosms averaged across weeks of the experiment, and a graph illustrating the first two axes of a principle coordinates analysis of the plankton communities across the three dispersal treatments using compositional data collected on the last day of the experiment.
Table A1. Chemical and physical data for the five source lakes for dispersers (B. Keller, Cooperative Freshwater Ecology Unit, unpublished data). Water chemistry was analyzed from a single sample taken in July or August 2005. DOC is dissolved organic carbon, AVG TP is the average total phosphorus concentration based on two replicate samples.
Lake |
Latitude |
Longitude |
DOC |
Total Nitrogen |
AVG TP |
Secchi |
Area |
Max Depth |
Bell |
461249 |
812054 |
5 |
270 |
5.3 |
3.45 |
335.51 |
24.5 |
Laurentian |
464496 |
809545 |
7.1 |
531 |
29.4 |
1.25 |
157 |
4.5 |
Ramsey |
464842 |
809643 |
3.5 |
50 |
7.3 |
7 |
792.2 |
21.5 |
Richard |
464380 |
809410 |
2.9 |
274 |
11.8 |
3.5 |
83.6 |
8.5 |
George |
460150 |
812401 |
1.5 |
136 |
2.9 |
9.25 |
188.53 |
39.7 |
Average |
|
|
4.0 |
252.2 |
11.3 |
4.89 |
311.37 |
19.74 |
Table A2. Mean and standard deviation (SD) of recorded values for temperature (°C), pH, dissolved oxygen (%), and conductivity (µS/cm) standardized to 25°C, averaged across weeks of the experiment.
Dispersal treatment |
Temperature (°C) |
pH |
DO (%) |
Conductivity (µS/cm) |
||||
|
Mean |
SD |
Mean |
SD |
Mean |
SD |
Mean |
SD |
0.1% |
19.1 |
0.3 |
7.0 |
0.1 |
103.4 |
4.0 |
25.2 |
3.0 |
1.3% |
19.2 |
0.4 |
7.0 |
0.2 |
103.2 |
3.3 |
25.1 |
1.9 |
2.5% |
19.2 |
0.6 |
7.0 |
0.1 |
104.3 |
2.9 |
25.0 |
1.9 |
9.6% |
19.4 |
0.2 |
7.0 |
0.1 |
103.6 |
2.7 |
26.5 |
1.8 |
Fig. A1. Principal coordinates analysis of plankton communities on the last day of the experiment. Yellow circles indicate tanks with low dispersal, orange circles indicate medium dispersal, red circles indicate high dispersal, and green circles indicate very high dispersal treatments.