Ecological Archives E096-089-A5
Jacquelyn L. A. Wood and Dylan J. Fraser. 2015. Similar plastic responses to elevated temperature among different-sized brook trout populations. Ecology 96:10101019. http://dx.doi.org/10.1890/14-1378.1
Appendix E. Directional Hypothesis: Absolute values of slopes between three temperature regimes in relation to N and Nb, Spearmans correlations, and GLMM results to assess the magnitude of plasticity in relation to population size for early-life history traits at CR.
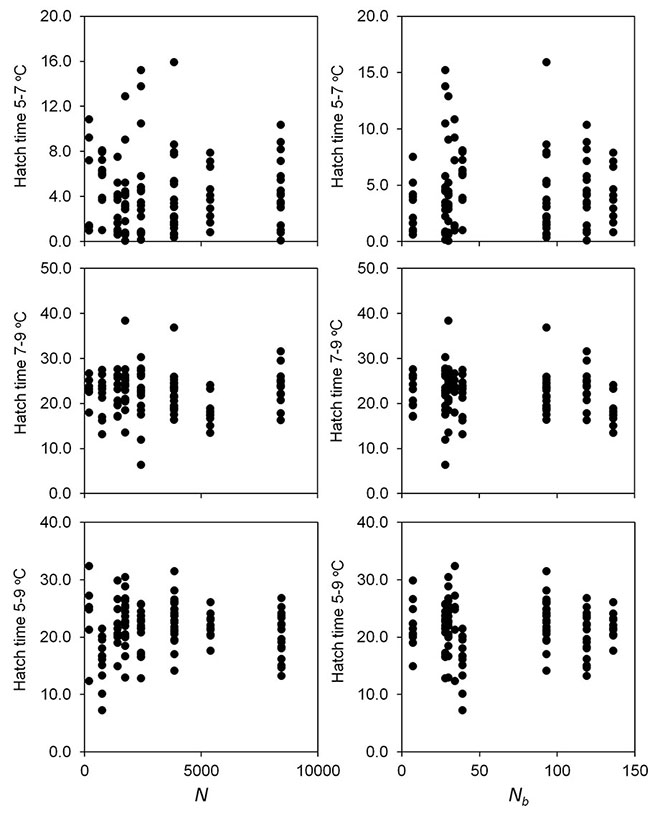
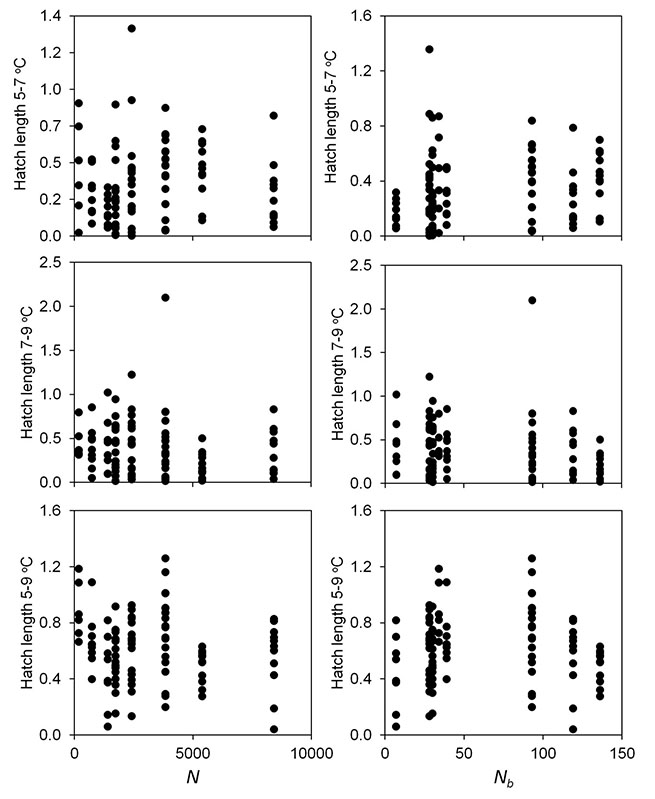
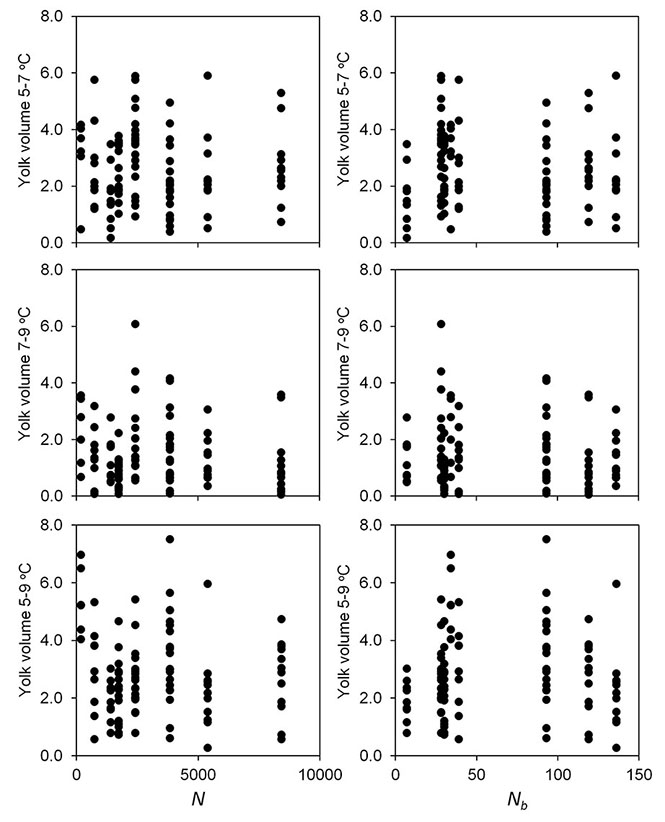
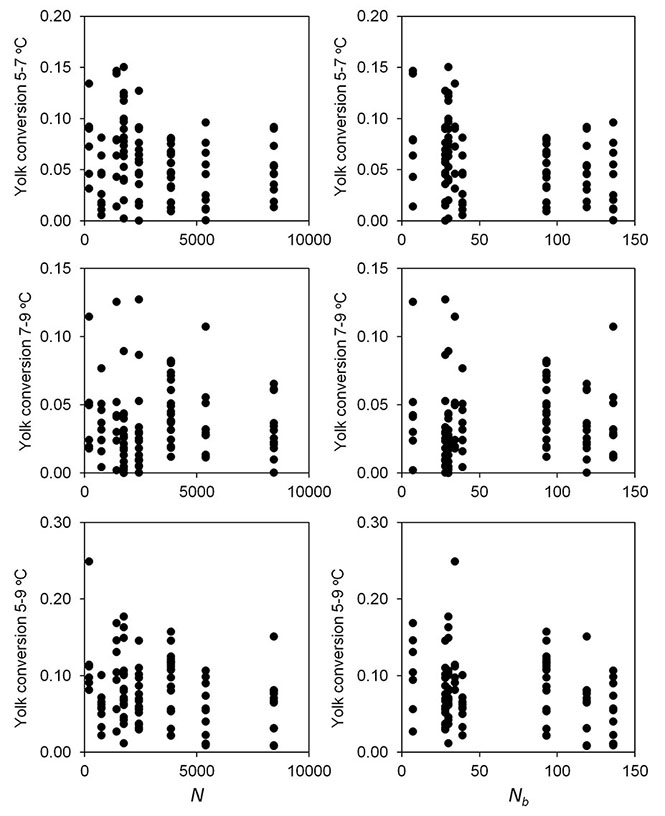
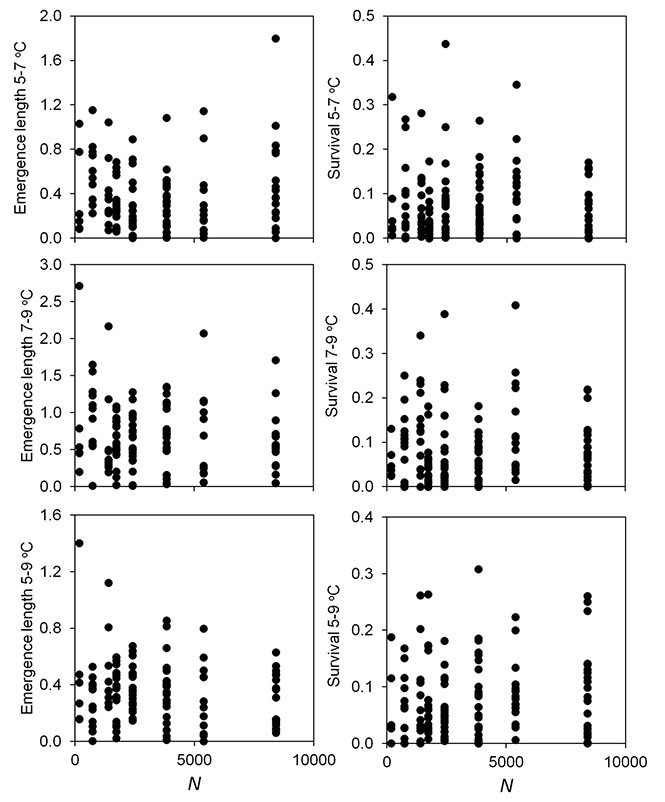
Fig. E1. Directional Hypothesis: Absolute values of slopes between three temperature regimes in relation to N and Nb for six early life-history traits to assess the magnitude of plasticity in relation to population size for eight brook trout populations at Cape Race, NL.
Table E1. Spearman's correlations for the relationship between the absolute value of slopes (magnitude of plasticity) between three temperature regimes and population size (N andNb) for eight Cape Race brook trout populations.
| Nb | N | |||
ρ |
p value |
ρ |
p value |
|
Hatch date |
||||
5–7 |
-0.055 |
0.56 |
-0.049 |
0.61 |
7–9 |
-0.080 |
0.40 |
-0.089 |
0.35 |
5–9 |
0.14 |
0.15 |
0.070 |
0.46 |
Hatch length |
||||
5–7 |
0.16 |
0.12 |
0.11 |
0.27 |
7–9 |
-0.12 |
0.24 |
-0.18 |
0.063 |
5–9 |
0.088 |
0.38 |
-0.084 |
0.40 |
Yolk-sac volume |
||||
5–7 |
-0.052 |
0.60 |
-0.041 |
0.68 |
7–9 |
0.0089 |
0.93 |
-0.063 |
0.53 |
5–9 |
0.10 |
0.30 |
-0.050 |
0.61 |
Emergence length |
||||
5–7 |
-0.049 |
0.59 |
-0.045 |
0.63 |
7–9 |
0.025 |
0.79 |
-0.052 |
0.58 |
5–9 |
-0.028 |
0.76 |
-0.053 |
0.56 |
Yolk-sac conversion |
||||
5–7 |
-0.20 |
0.052 |
-0.20 |
0.048 |
7–9 |
0.17 |
0.10 |
0.072 |
0.48 |
5–9 |
-0.049 |
0.63 |
-0.17 |
0.087 |
Survival |
||||
5–7 |
0.049 |
0.56 |
0.091 |
0.28 |
7–9 |
-0.049 |
0.56 |
0.046 |
0.59 |
5–9 |
0.043 |
0.61 |
0.13 |
0.11 |
*<0.05, **<0.01, ***<0.001
Table E2. GLMM regression coefficients (±SE) for the effect ofNb, egg size, family size, and interactions on magnitude of plasticity for four of six early life-history traits for eight Cape Race trout populations. Values for the random effect are standard deviations with the proportion of total variation attributed to the random effect in brackets.
Hatch date |
Yolk-sac volume |
Hatch length |
|||||||
Fixed effects |
5–7 |
7–9 |
5–9 |
5–7 |
7–9 |
5–9 |
5–7 |
7–9 |
5–9 |
Nb |
4.7×10⁻³ (0.043) |
-0.10 |
-0.010 |
0.026 |
2.3×10⁻³ |
-5.6×10⁻³ |
2.1×10⁻³ |
6.3×10⁻⁴ |
3.1×10⁻³ |
Egg size |
-0.24 |
-0.31 |
-0.10 |
0.19** |
0.031 |
0.070 |
4.6×10⁻³ |
-0.012 (0.016) |
7.7×10⁻³ |
Family size |
4.30* |
-1.18 |
0.94 |
1.28 |
-0.16 |
-0.32 |
0.038 |
0.13 |
0.14 |
Nb× egg size |
2.1×10⁻³ 2.2×10⁻³ |
5.5×10⁻³ |
1.5×10⁻³ |
-1.1×10⁻³ |
-1.8×10⁻⁵ |
2.3×10⁻⁴ |
-6.3×10⁻⁵ |
1.2×10⁻⁴ |
-8.3×10⁻⁵ |
Nb× family size |
-0.043* |
0.014 |
-0.011 |
-0.016 |
-4.7×10⁻³ |
8.3×10⁻⁶ |
-5.1×10⁻⁴ |
-1.8×10⁻³ |
-2.0×10⁻³ |
Random effect |
5–7 |
7–9 |
5–9 |
5–7 |
7–9 |
5–9 |
5–7 |
7–9 |
5–9 |
Stream |
1.08 |
1.19 |
2.41 |
0.00 |
0.40 |
1.07 |
0.063 |
8.1×10⁻⁷ |
0.12 |
Yolk-sac conversion efficiency |
|||
Fixed effects |
5–7 |
7–9 |
5–9 |
Nb |
-1.9×10⁻⁴ |
-8.1×10⁻⁶ |
-7.4×10⁻⁴ |
Egg size |
-5.4×10⁻³*** |
1.1×10⁻⁴ |
-4.8×10⁻³* |
Family size |
0.046* |
-0.036* |
-0.014 |
Nb × egg size |
2.6×10⁻⁵ |
-1.3×10⁻⁵ |
2.1×10⁻⁵ |
Nb × family size |
-4.7×10⁻⁴* |
4.2×10⁻⁴* |
-2.8×10⁻⁴ |
Random effect |
5–7 |
7–9 |
5–9 |
Stream |
1.7×10⁻⁷ |
1.5×10⁻⁷ |
0.014 |
*<0.05, **<0.01, ***<0.001
Table E3. GLMM regression coefficients (±SE) for the effect of N, egg size, family size, and interactions on magnitude of plasticity for six early life-history traits for eight Cape Race trout populations. Values for the random effect are standard deviations with the proportion of total variation attributed to the random effect in brackets.
|
Hatch length |
Yolk-sac conversion efficiency |
Survival |
||||||
Fixed effects |
5–7 |
7–9 |
5–9 |
5–7 |
7–9 |
5–9 |
5–7 |
7–9 |
5–9 |
N |
2.4×10⁻⁵ |
-7.6×10⁻⁵ |
1.6×10⁻⁵ |
-2.8×10⁻⁶ |
-8.1×10⁻⁷ |
-1.0×10⁻⁵ |
-1.2×10⁻⁵ |
-2.0×10⁻⁵ |
-6.6×10⁻⁶ |
Egg size |
5.9×10⁻³ |
-4.0×10⁻³ |
6.9×10⁻³ |
-5.0×10⁻³** |
-1.1×10⁻⁴ |
-4.2×10⁻³ |
3.8×10⁻³ |
-2.0×10⁻³ |
-9.5×10⁻⁴ |
Family size |
-0.022 |
0.055 |
0.044 |
0.036* |
-0.021 |
-4.7×10⁻³ |
-0.054 |
-0.061 |
-0.042 |
N × egg size |
-1.7×10⁻⁶ |
3.3×10⁻⁷ |
-1.3×10⁻⁶ |
4.3×10⁻⁷ |
-2.1×10⁻⁷ |
2.3×10⁻⁷ |
1.4×10⁻⁷ |
6.1×10⁻⁷ |
3.7×10⁻⁷ |
N × family size |
8.3×10⁻⁶ |
-1.6×10⁻⁵ |
-1.5×10⁻⁵ |
-8.2×10-6* 3.9×10-6 |
5.3×10⁻⁶ 3.6×10⁻⁶ |
3.3×10⁻⁶ 5.2×10⁻⁶ |
1.1×10⁻⁵ 7.6×10⁻⁶ |
1.3×10⁻⁵ 7.8×10⁻⁶ |
5.8×10⁻⁶ 6.7×10⁻⁶ |
Random effect |
5–7 |
7–9 |
5–9 |
5–7 |
7–9 |
5–9 |
5–7 |
7–9 |
5–9 |
Stream |
0.066 |
0.00 |
0.11 |
7.1×10⁻³ |
6.5×10⁻³ |
0.011 |
0.00 |
0.022 |
0.00 |
Hatch date |
Yolk-sac volume |
Emergence length |
|||||||
Fixed effects |
5–7 |
7–9 |
5–9 |
5–7 |
7–9 |
5–9 |
5–7 |
7–9 |
5–9 |
N |
-5.4×10⁻⁴ |
-1.9×10⁻³ |
-2.4×10⁻⁴ |
3.5×10⁻⁴ |
8.9×10⁻⁵ |
-1.3×10⁻⁴ |
6.8×10⁻⁵ |
9.9×10⁻⁷ |
-3.8×10⁻⁵ |
Egg size |
-0.16 |
-0.26 |
-0.078 |
0.17** |
0.048 |
0.11 |
0.015 |
0.037* |
-2.1×10⁻³ |
Family size |
0.85 |
-0.94 |
1.18 |
0.67 |
-0.22 |
-0.80 |
-0.013 |
-0.26 |
0.43 |
N × egg size |
3.4×10⁻⁵ |
1.0×10⁻⁴ |
3.1×10⁻⁵ |
-1.6×10⁻⁵ |
-4.4×10⁻⁶ |
-7.0×10⁻⁶ |
-3.7×10⁻⁶ |
-6.0×10⁻⁶ |
2.3×10⁻⁶ |
N × family size |
-8.2×10⁻⁵ |
2.0×10⁻⁴ 5.5×10⁻⁴ |
-3.4×10⁻⁴ |
-1.7×10⁻⁴ |
-8.8×10⁻⁵ |
1.4×10⁻⁴ |
1.3×10⁻⁶ |
8.8×10⁻⁵ |
-1.5×10⁻⁵ |
Random effect |
5–7 |
7–9 |
5–9 |
5–7 |
7–9 |
5–9 |
5–7 |
7–9 |
5–9 |
Stream |
0.84 |
1.02 |
2.38 |
0.31 |
0.36 |
0.98 |
0.077 |
0.00 |
6.4×10⁻⁷ |
*<0.05, **<0.01, ***<0.001