Ecological Archives E096-084-A3
Lucía Vivanco, Irina C. Irvine, and Jennifer B. H. Martiny. 2015. Nonlinear responses in salt marsh functioning to increased nitrogen addition. Ecology 96:936–947. http://dx.doi.org/10.1890/13-1983.1
Appendix C. Model fitting of plant, microbial, and sediment responses to nitrogen addition gradient, and a figure showing data fitting to five models and their Akaike values are presented.
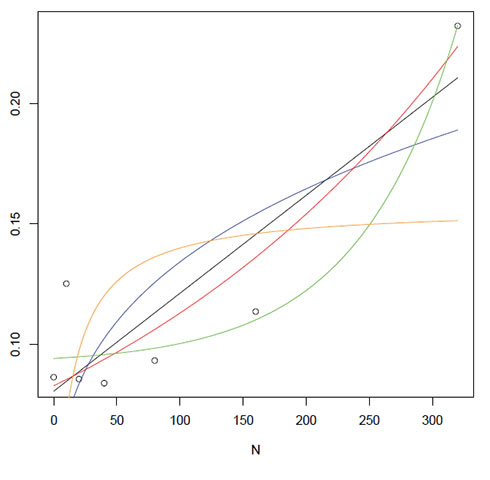
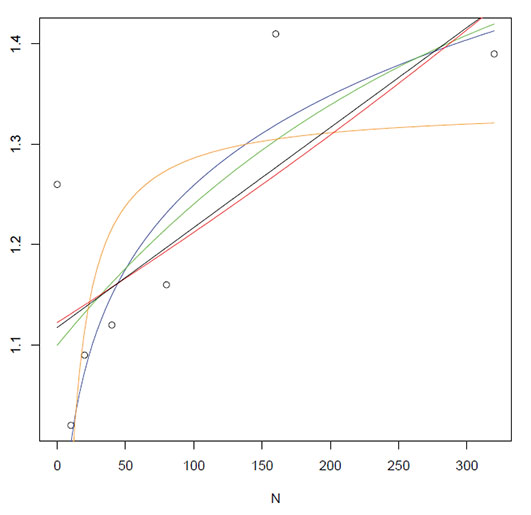
Table C1. Results of fitting data to a linear, power, exponential, exponential with asymptote and Monod functions. The preferred model was selected based on the highest Akaike weight (in bold).
|
|
Linear function |
Power function |
Exponential function |
Exponential with asymptopte function |
Monod function |
Plant characteristics |
|
|
|
|
|
|
Plant biomass_7 months (kg/m²) |
|
|
|
|
|
|
|
AICc |
0.18 |
25.69 |
0.33 |
2.28 |
25.78 |
|
Akaike weight |
0.44 |
0 |
0.41 |
0.15 |
0 |
Plant regrowth_14 months (kg/m²) |
|
|
|
|
|
|
|
AICc |
11.62 |
17.42 |
13.47 |
7.19 |
18.2 |
|
Akaike weight |
0.09 |
0.01 |
0.04 |
0.86 |
0 |
Leaf N content (%) |
|
|
|
|
|
|
|
AICc |
9.9 |
31.68 |
10.26 |
1.32 |
31.7 |
|
Akaike weight |
0.01 |
0 |
0.01 |
0.98 |
0 |
Microbial processes |
|
|
|
|
|
|
Methane flux (mg m-2 d-1) |
|
|
|
|
|
|
|
AICc |
1.55 |
3.58 |
1.9 |
4.01 |
4.08 |
|
Akaike weight |
0.36 |
0.13 |
0.3 |
0.11 |
0.1 |
Potential net N mineralization (μg NH4-N·g-1 dry sediment·d-1) |
|
|
|
|
|
|
|
AICc |
-4.14 |
- |
1.47 |
-3.79 |
-4.18 |
|
Akaike weight |
0.34* |
- |
0.02 |
0.29 |
0.35 |
Sediment characteristics |
|
|
|
|
|
|
Total N (kg/m²) |
|
|
|
|
|
|
|
TRE |
|
|
|
|
|
|
AICc |
-18.88 |
-8.87 |
-21.86 |
-23.95 |
-6.69 |
|
Akaike weight |
0.06 |
0 |
0.25 |
0.7 |
0 |
Extractable ammonium (μg NH4-N /g dry sediment) |
|
|
|
|
|
|
|
CSM |
|
|
|
|
|
|
AICc |
59.04 |
59.64 |
65.59 |
60.74 |
59.36 |
|
Akaike weight |
0.33 |
0.24 |
0.01 |
0.14 |
0.28 |
|
TRE |
|
|
|
|
|
|
AICc |
42.42 |
47.82 |
33.64 |
32.94 |
- |
|
Akaike weight |
0.01 |
0 |
0.41 |
0.58 |
- |
*Data fit to linear and Monod functions similarly. Linear function was prefered due to parsimony.
Fig. C1. (below) Responses to the N addition gradient. The best fits of five functions to each dataset are shown: linear (y = ax + b) (black line), power (y = axb) (blue line), exponential with a horizontal asymptote at zero (y = aebx) (red line), a three-parameter exponential with a horizontal asymptote at c (y = aebx+ c) (green line), and Monod (y = a/(1 + bx-1) (orange line), where x is nitrogen concentration, and a, b, and c are constants. Each data point (circles) is an average ofn = 15, exceptfor panels (f) - (h) where n = 5 (see Methods).
(a) Plant biomass, total harvest after 7 months (kg/m²)

(b) Plant biomass, regrowth after 14 months (kg/m²)
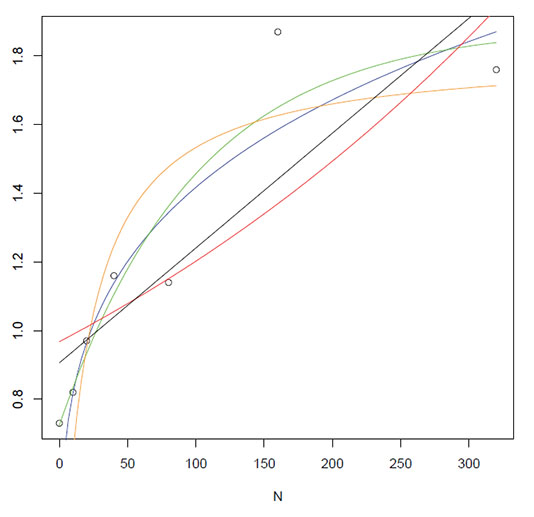
(c) Leaf N content (%)
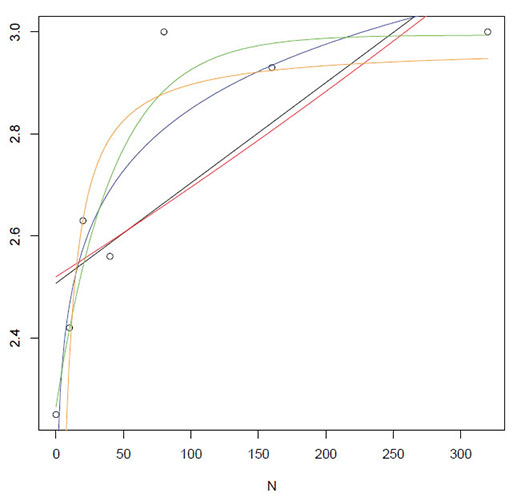
(d) CH4 flux (mg CH4·m-2·d-1)
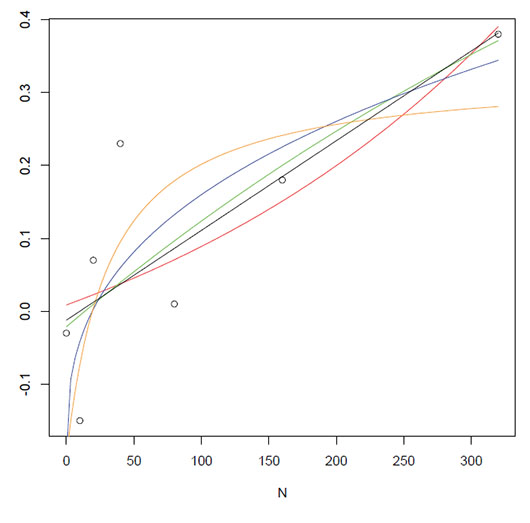
(e) Potential net N mineralization (μg NH4-N g-1·dry sediment·d-1) (The power function could not be fit.)
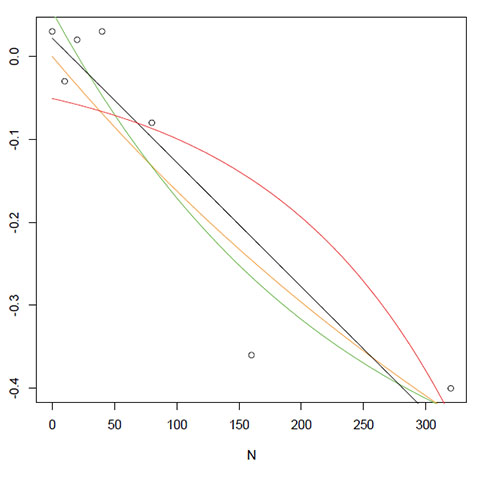
(f) CSM Extractable NH4 (μg NH4-N /g dry sediment)
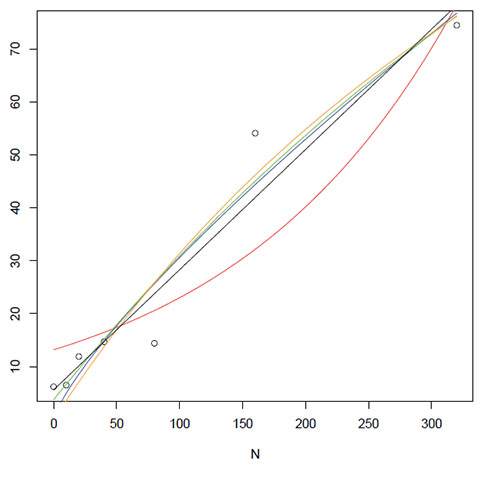
(g) TRE Extractable NH4 (μg NH4-N /g dry sediment) (Note: The Monod function could not be fit.)
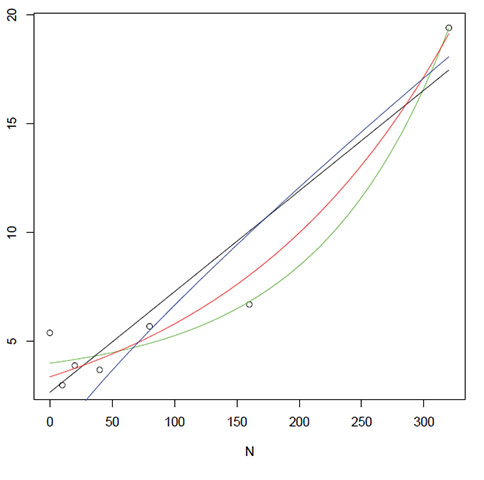
(h) TRE Sediment N content (kg/m²)
