Ecological Archives E096-076-A2
Aarón González-Castro, María Calviño-Cancela, and Manuel Nogales. 2015. Comparing seed dispersal effectiveness by frugivores at the community level. Ecology 96:808818. http://dx.doi.org/10.1890/14-0655.1
Appendix B. Results (figures and tables) of qualitative subcomponents of seed dispersal effectiveness (SDE).
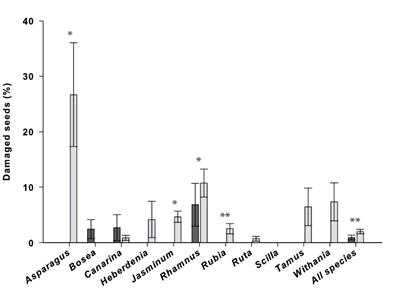
Fig. B1. Seed damage after gut passage. Percentage (mean ± SE) of seeds damaged by birds (dark gray bars) and lizards (light gray bars). Asterisks on top of the bars indicate significant differences between dispersers, as tested with likelihood ratio tests (G tests). Comparisons between dispersers were not performed for Ruta, Tamus and Scilla, which were only dispersed by lizards. Significance levels are as follows: *P < 0.05 and **P < 0.01.
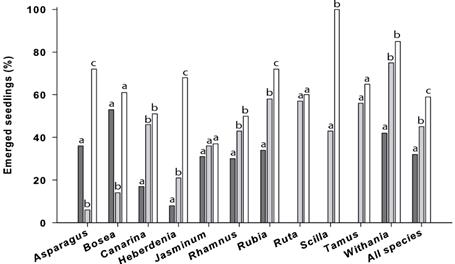
Fig. B2. Effect of gut passage on seedling emergence. Percentage of seedling emergence from seeds consumed by birds (dark gray bars), by lizards (light gray bars) and from control seeds (white bars). Different letters on top of bars indicate significant differences between treatments (dispersers and control seeds) for each plant species, as tested with likelihood ratio tests (G tests) and after the Bonferroni correction (α' = 0.016).
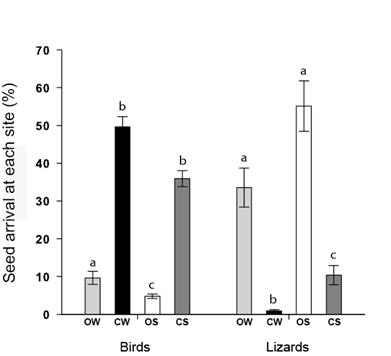
Fig. B3. Spatial pattern of seed rain generated by birds and lizards, showing the percentage of seeds (mean ± SE) deposited in open sites in woodland (OW; light gray bars), beneath canopies in woodland (CW; black bars), in open sites in shrubland (OS; white bars) and beneath canopies in shrubland (CS; dark gray bars). For each disperser type, different letters on top of bars indicate significant differences between sites in the percentage of seeds dispersed, as tested with a quasi-GLM (with Poisson error distribution) and after the Bonferroni correction (α' = 0.008).
Table B1. Results of the GLM (with binomial error distribution) to test the effect of habitat, microhabitat, plant species and the interactions between them on seedling emergence. Chi-squared values (χ2) of significant factors are highlighted in bold.
|
SDE1 |
||
Factor |
χ2 |
df |
P value |
Habitat |
43.98 |
1 |
< 0.001 |
Microhabitat |
187.79 |
1 |
< 0.001 |
Plant species |
1759.72 |
10 |
< 0.001 |
Habitat : Microhabitat |
0.008 |
1 |
0.93 |
Habitat : Plant species |
108.357 |
10 |
< 0.001 |
Microhabitat : Plant species |
302.096 |
10 |
< 0.001 |
Habitat : Microhabitat : Plant species |
75.623 |
10 |
< 0.001 |
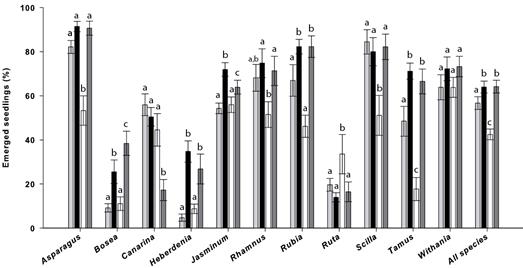
Fig. B4. Effect of seed deposition site on seedling emergence. Percentage of seeds becoming seedlings (mean ± SE) for each plant species and all species pooled in different habitats and microhabitats: open sites in woodland (light gray bars), beneath canopies in woodland (black bars), open sites in shrubland (white bars) and beneath canopies in shrubland (dark gray bars). Within species, different letters on top of bars indicate significant differences between sites in seedling emergence, as tested with a GLM (with binomial error distribution) and after the Bonferroni correction (α' = 0.008).
Table B2. Results of the GLM (with binomial error distribution) to test the effect of habitat, microhabitat, plant species and the interactions between them on the amount of surviving seedlings. Chi-squared values (χ2) of significant factors are highlighted in bold.
|
|
SDE2 |
||
Factor |
|
χ2 |
df |
P value |
Habitat |
|
0.560 |
1 |
0.45 |
Microhabitat |
|
44.923 |
1 |
< 0.001 |
Plant species |
|
293.280 |
7 |
< 0.001 |
Habitat : Microhabitat |
|
1.3145 |
1 |
0.25 |
Habitat : Plant species |
|
20.4152 |
7 |
0.004 |
Microhabitat : Plant species |
|
16.7572 |
7 |
0.02 |
Habitat : Microhabitat : Plant species |
|
12.066 |
7 |
0.06 |
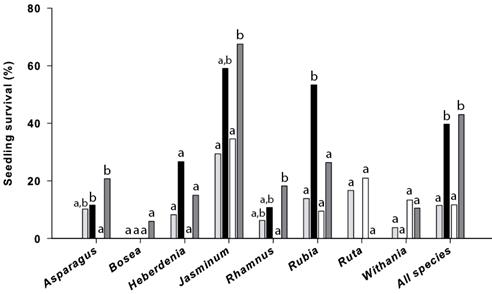
Fig. B5. Effect of seed deposition site on seedling survival. Percentage of seedlings surviving in open sites in woodland (light gray bars), beneath canopies in woodland (black bars), in open sites in shrubland (white bars) and beneath canopies in shrubland (dark gray bars). Within species, different letters on top of bars indicate significant differences between sites in seedling survival as tested with likelihood ratio tests (G tests) and after the Bonferroni correction (α' = 0.008).