Ecological Archives E096-075-A3
C. V. Haridas, Kathleen H. Keeler, and Brigitte Tenhumberg. 2015. Variation in the local population dynamics of the short-lived Opuntia macrorhiza (Cactaceae). Ecology 96:800807. http://dx.doi.org/10.1890/13-1984.1
Appendix C. Elasticities to means of matrix elements for all the five plots (Fig. C1). Observed annual stage frequencies and the Stable Stage Distribution (SSD) for plots 52 and 57 (Fig. C2) and plots 28, 61, and 102 (Fig. C3) are also shown.
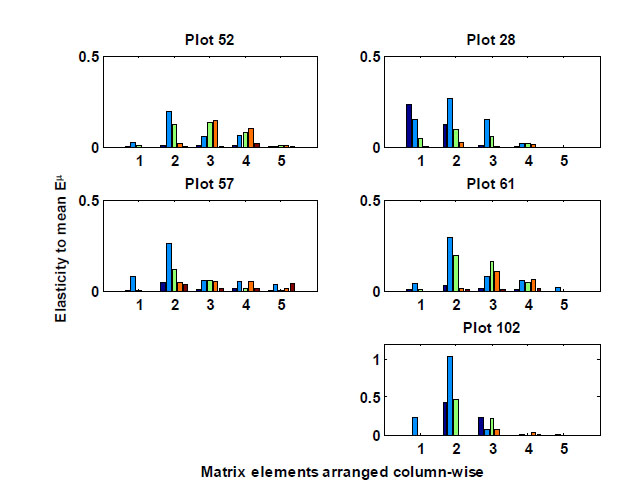
Fig. C1. Elasticity to means of matrix elements for populations Opuntia macrorhiza var. macrorhiza in plots 52, 57, 28, 61, and 102. Matrix elements are arranged column wise (j = 1, 2, 3, 4, 5). Each bar is the elasticity to the rate of transition from the stage represented by the number on the x-axis to other stages.
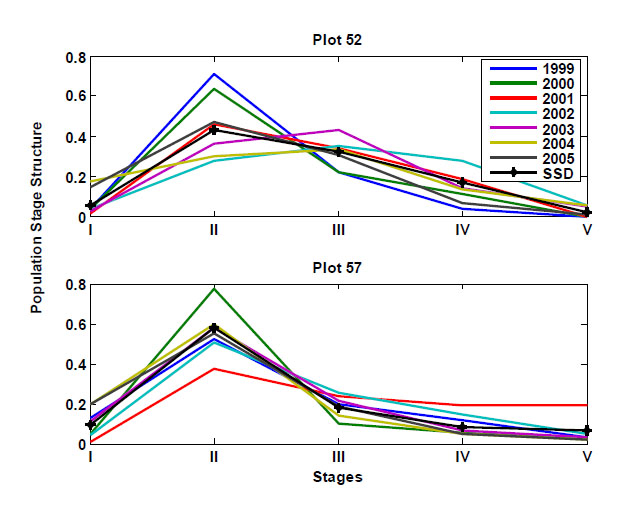
Fig. C2. Year-wise stage structures (years 1999–2005) of Opuntia macrorhiza (Cactaceae) for plots 52 (upper panel) and 57 (lower) from Boulder, Boulder County, Colorado. Stable stage distribution (SSD) calculated form the average demographic matrix is shown with a *.
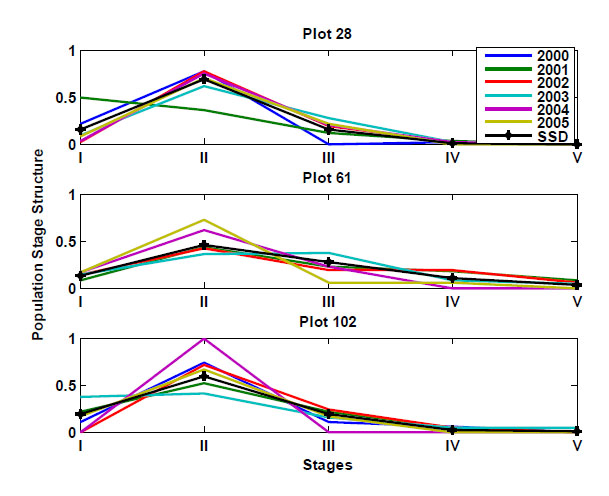
Fig. C3. Year-wise stage structures (years 2000–2005) of Opuntia macrorhiza (Cactaceae) for plots 28 (upper panel), 61 (middle panel), and 102 (bottom panel) from Boulder, Boulder County, Colorado. Stable stage distribution (SSD) calculated form the average demographic matrix is shown with a *.